

UI guide
One page per screen of the console. Each screen works on the connection at the top of the side menu; click it to pick another one. Click a screenshot to see it at full size.
Connections
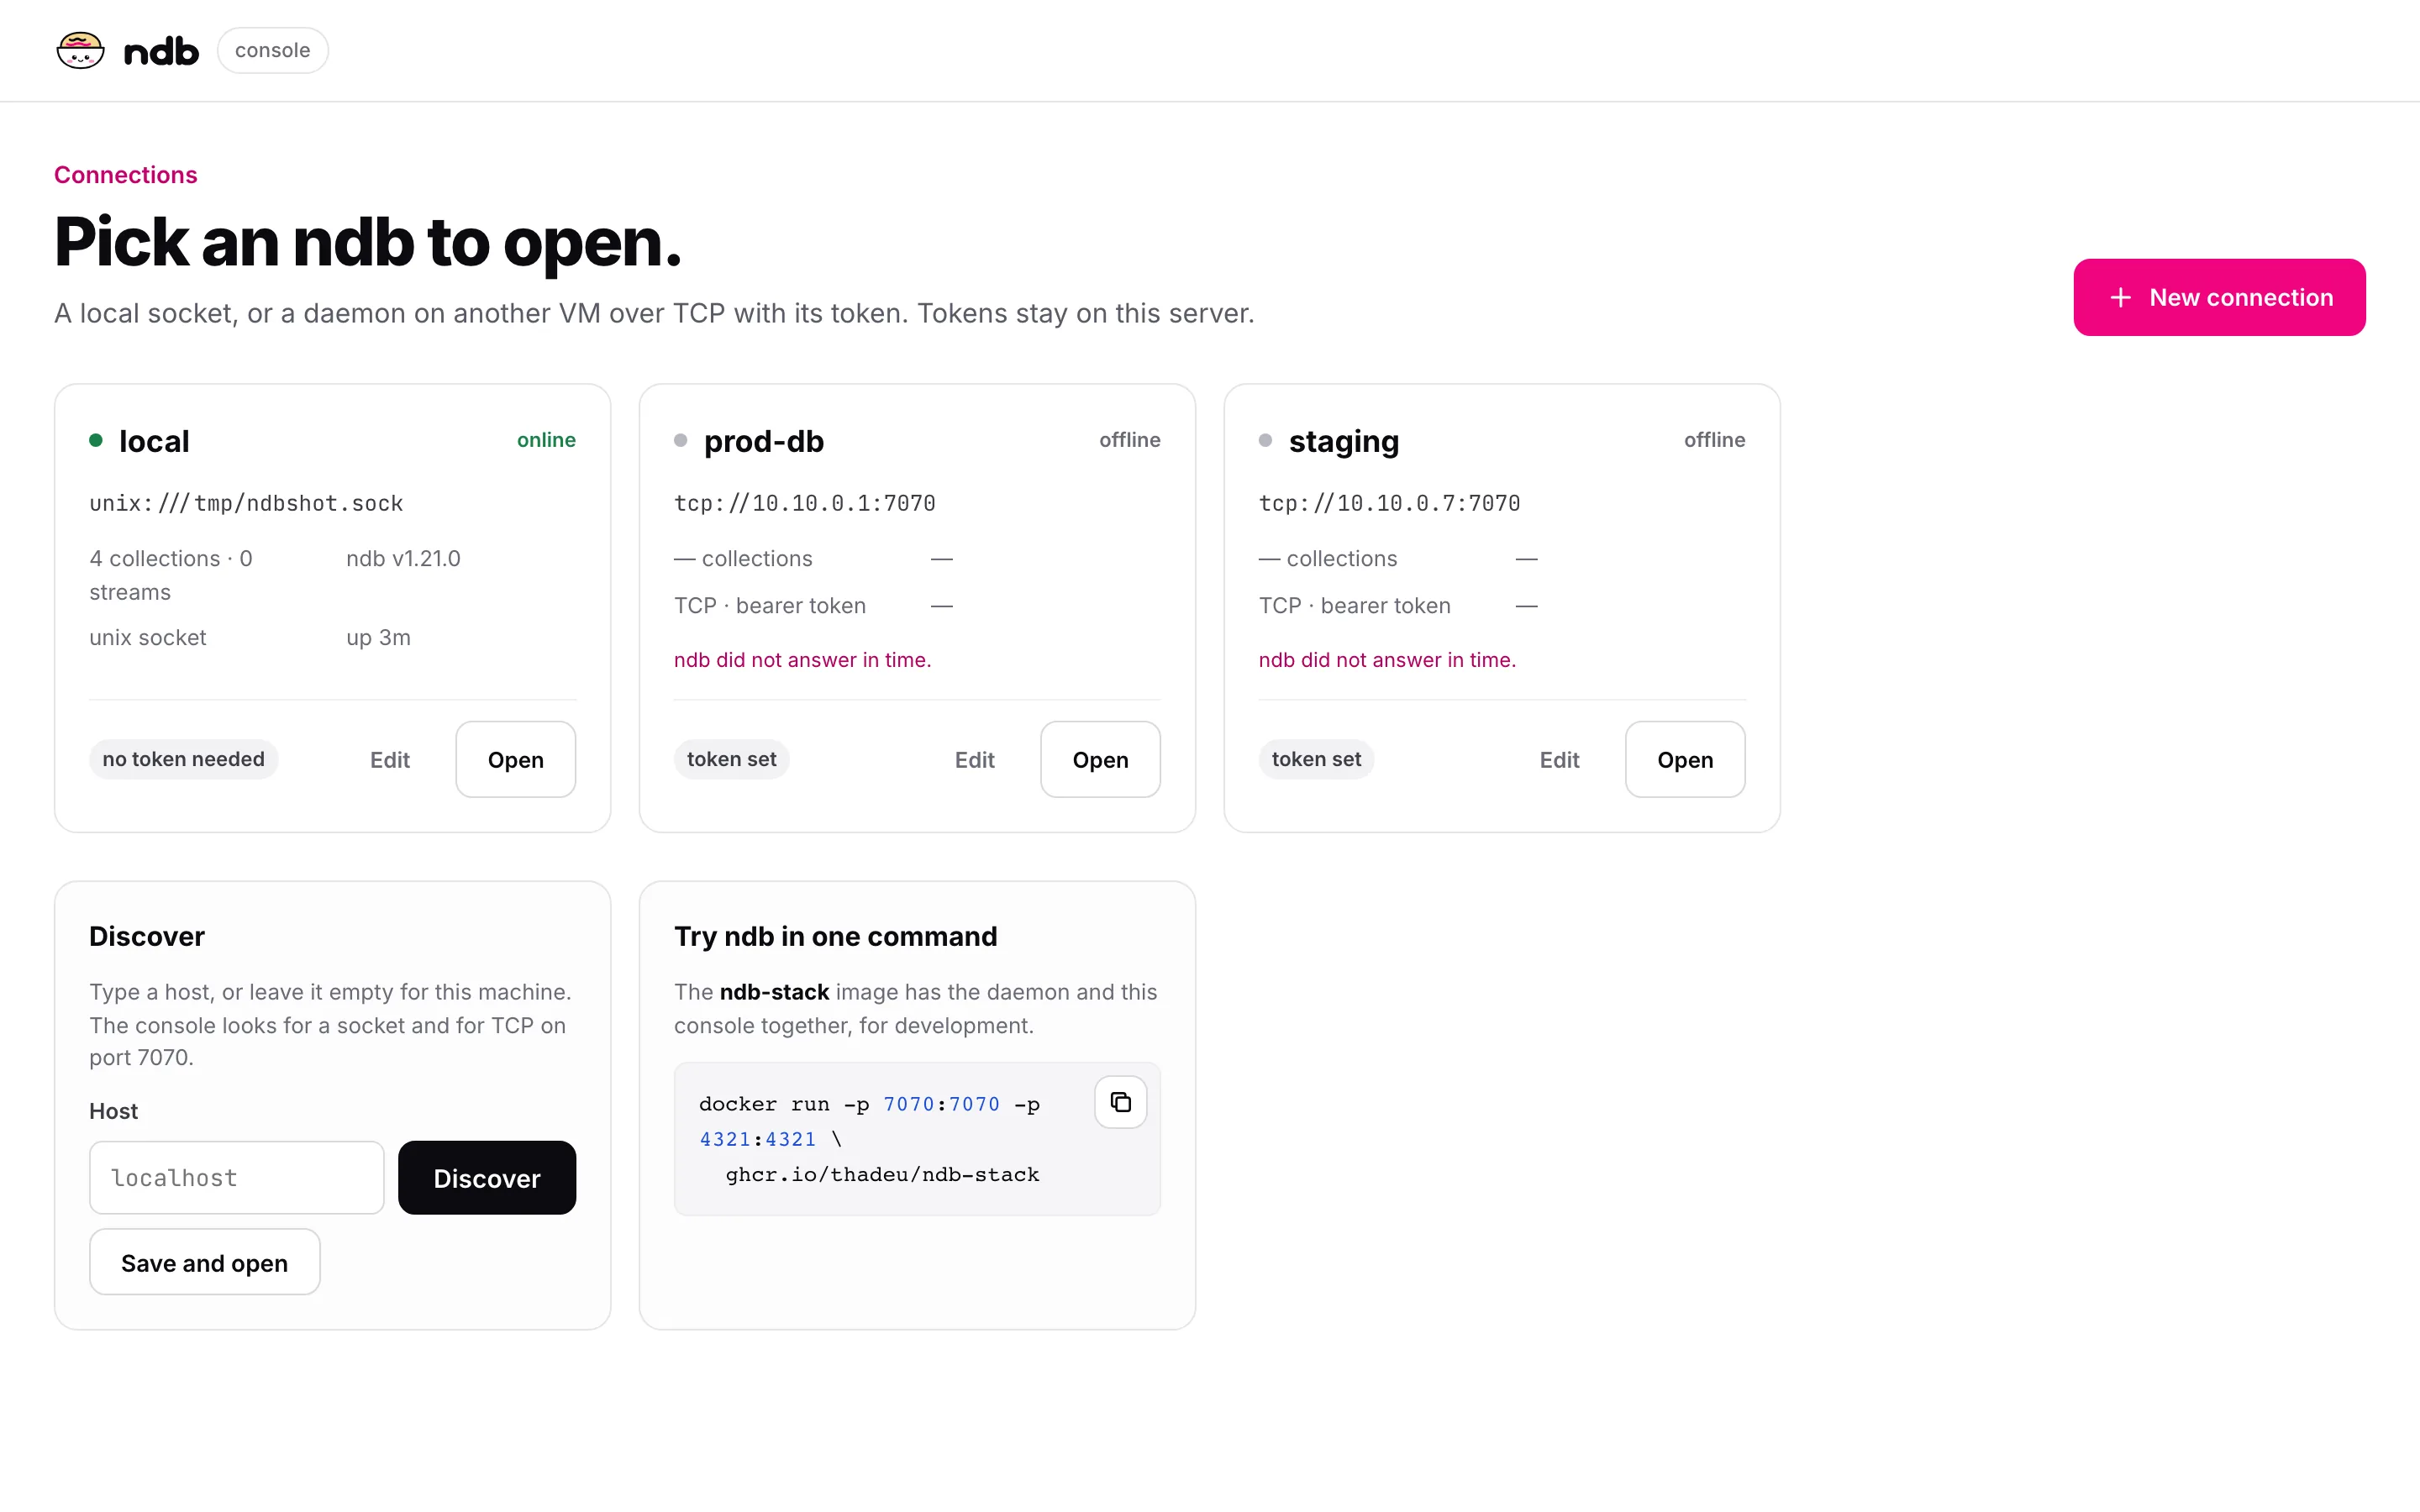
Each card shows if the daemon answers, its collections, version and uptime. Open opens it, Edit changes it. The Discover card finds a daemon on this machine or on a host.
New connection and Discover
+ New connection opens a drawer with three fields:
- Name, optional. Empty takes
localfor a socket, or the host for TCP. - URL or host. Type the full URL, or a host and press Discover. Click a result to fill the URL.
- Token, only for TCP with a token. If a result needs one, the cursor moves there.
Test checks the connection, Save and open keeps it.
What Discover searches:
- Empty,
localhost,127.0.0.1, or::1: unix sockets:listen.unixofndb.yml(NDB_CONFIG,./ndb.yml,/etc/ndb/ndb.yml),/run/ndb/ndb.sock, and each*.sockin/run/ndb,/var/run,/run,/tmp,$XDG_RUNTIME_DIR, and the subfolders of/tmpwithndbin the name (at most 50). It also tries TCP on127.0.0.1. - Another host: TCP on the port in the field (
10.10.0.1:7071), or on7070. - Each candidate gets
GET /healthwith an 800 ms timeout.okshows the version and the collection count,needs a tokenis a401,startingis a503while ndb recovers. Anything else is dropped. The probe never sends a saved token.
Dashboard
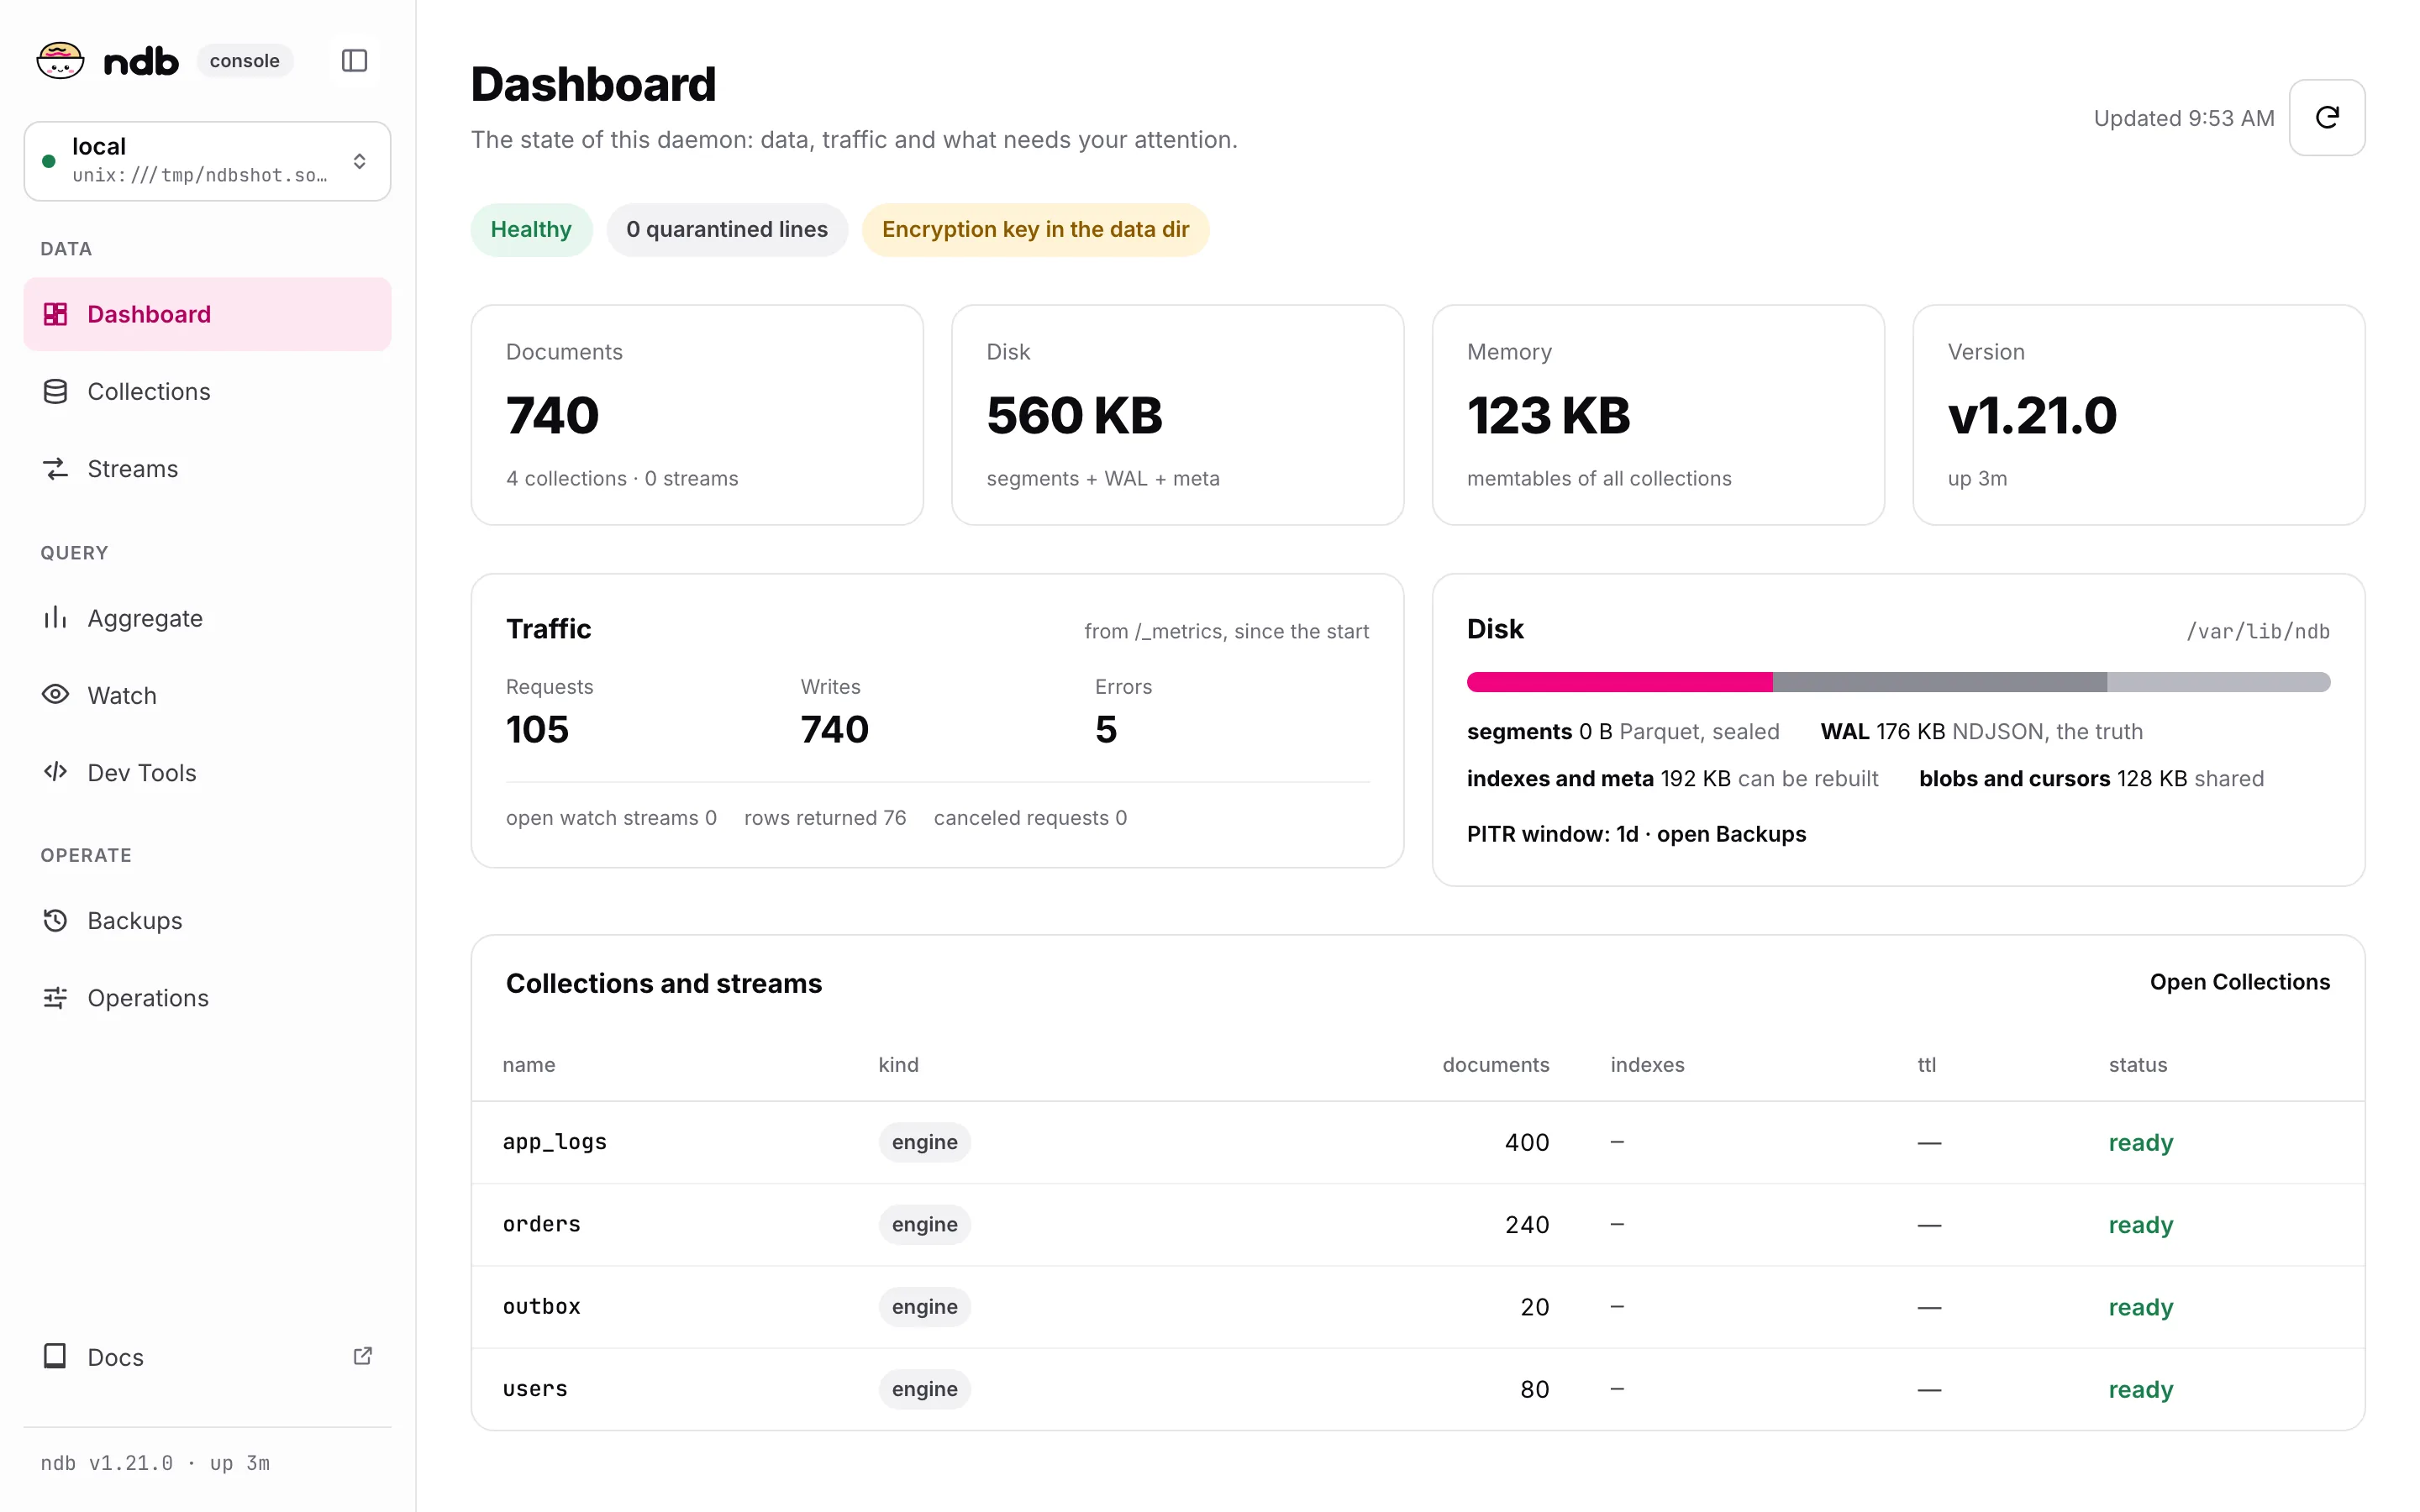
The state of the daemon: health, quarantined lines, and the notes that need attention (for example, the encryption key in the data dir). The cards show documents, disk, memory and version. Traffic comes from /_metrics. The disk bar splits segments, WAL, indexes and meta, and blobs and cursors. The table lists each collection and stream with its kind, documents, indexes, TTL and status.
Collections
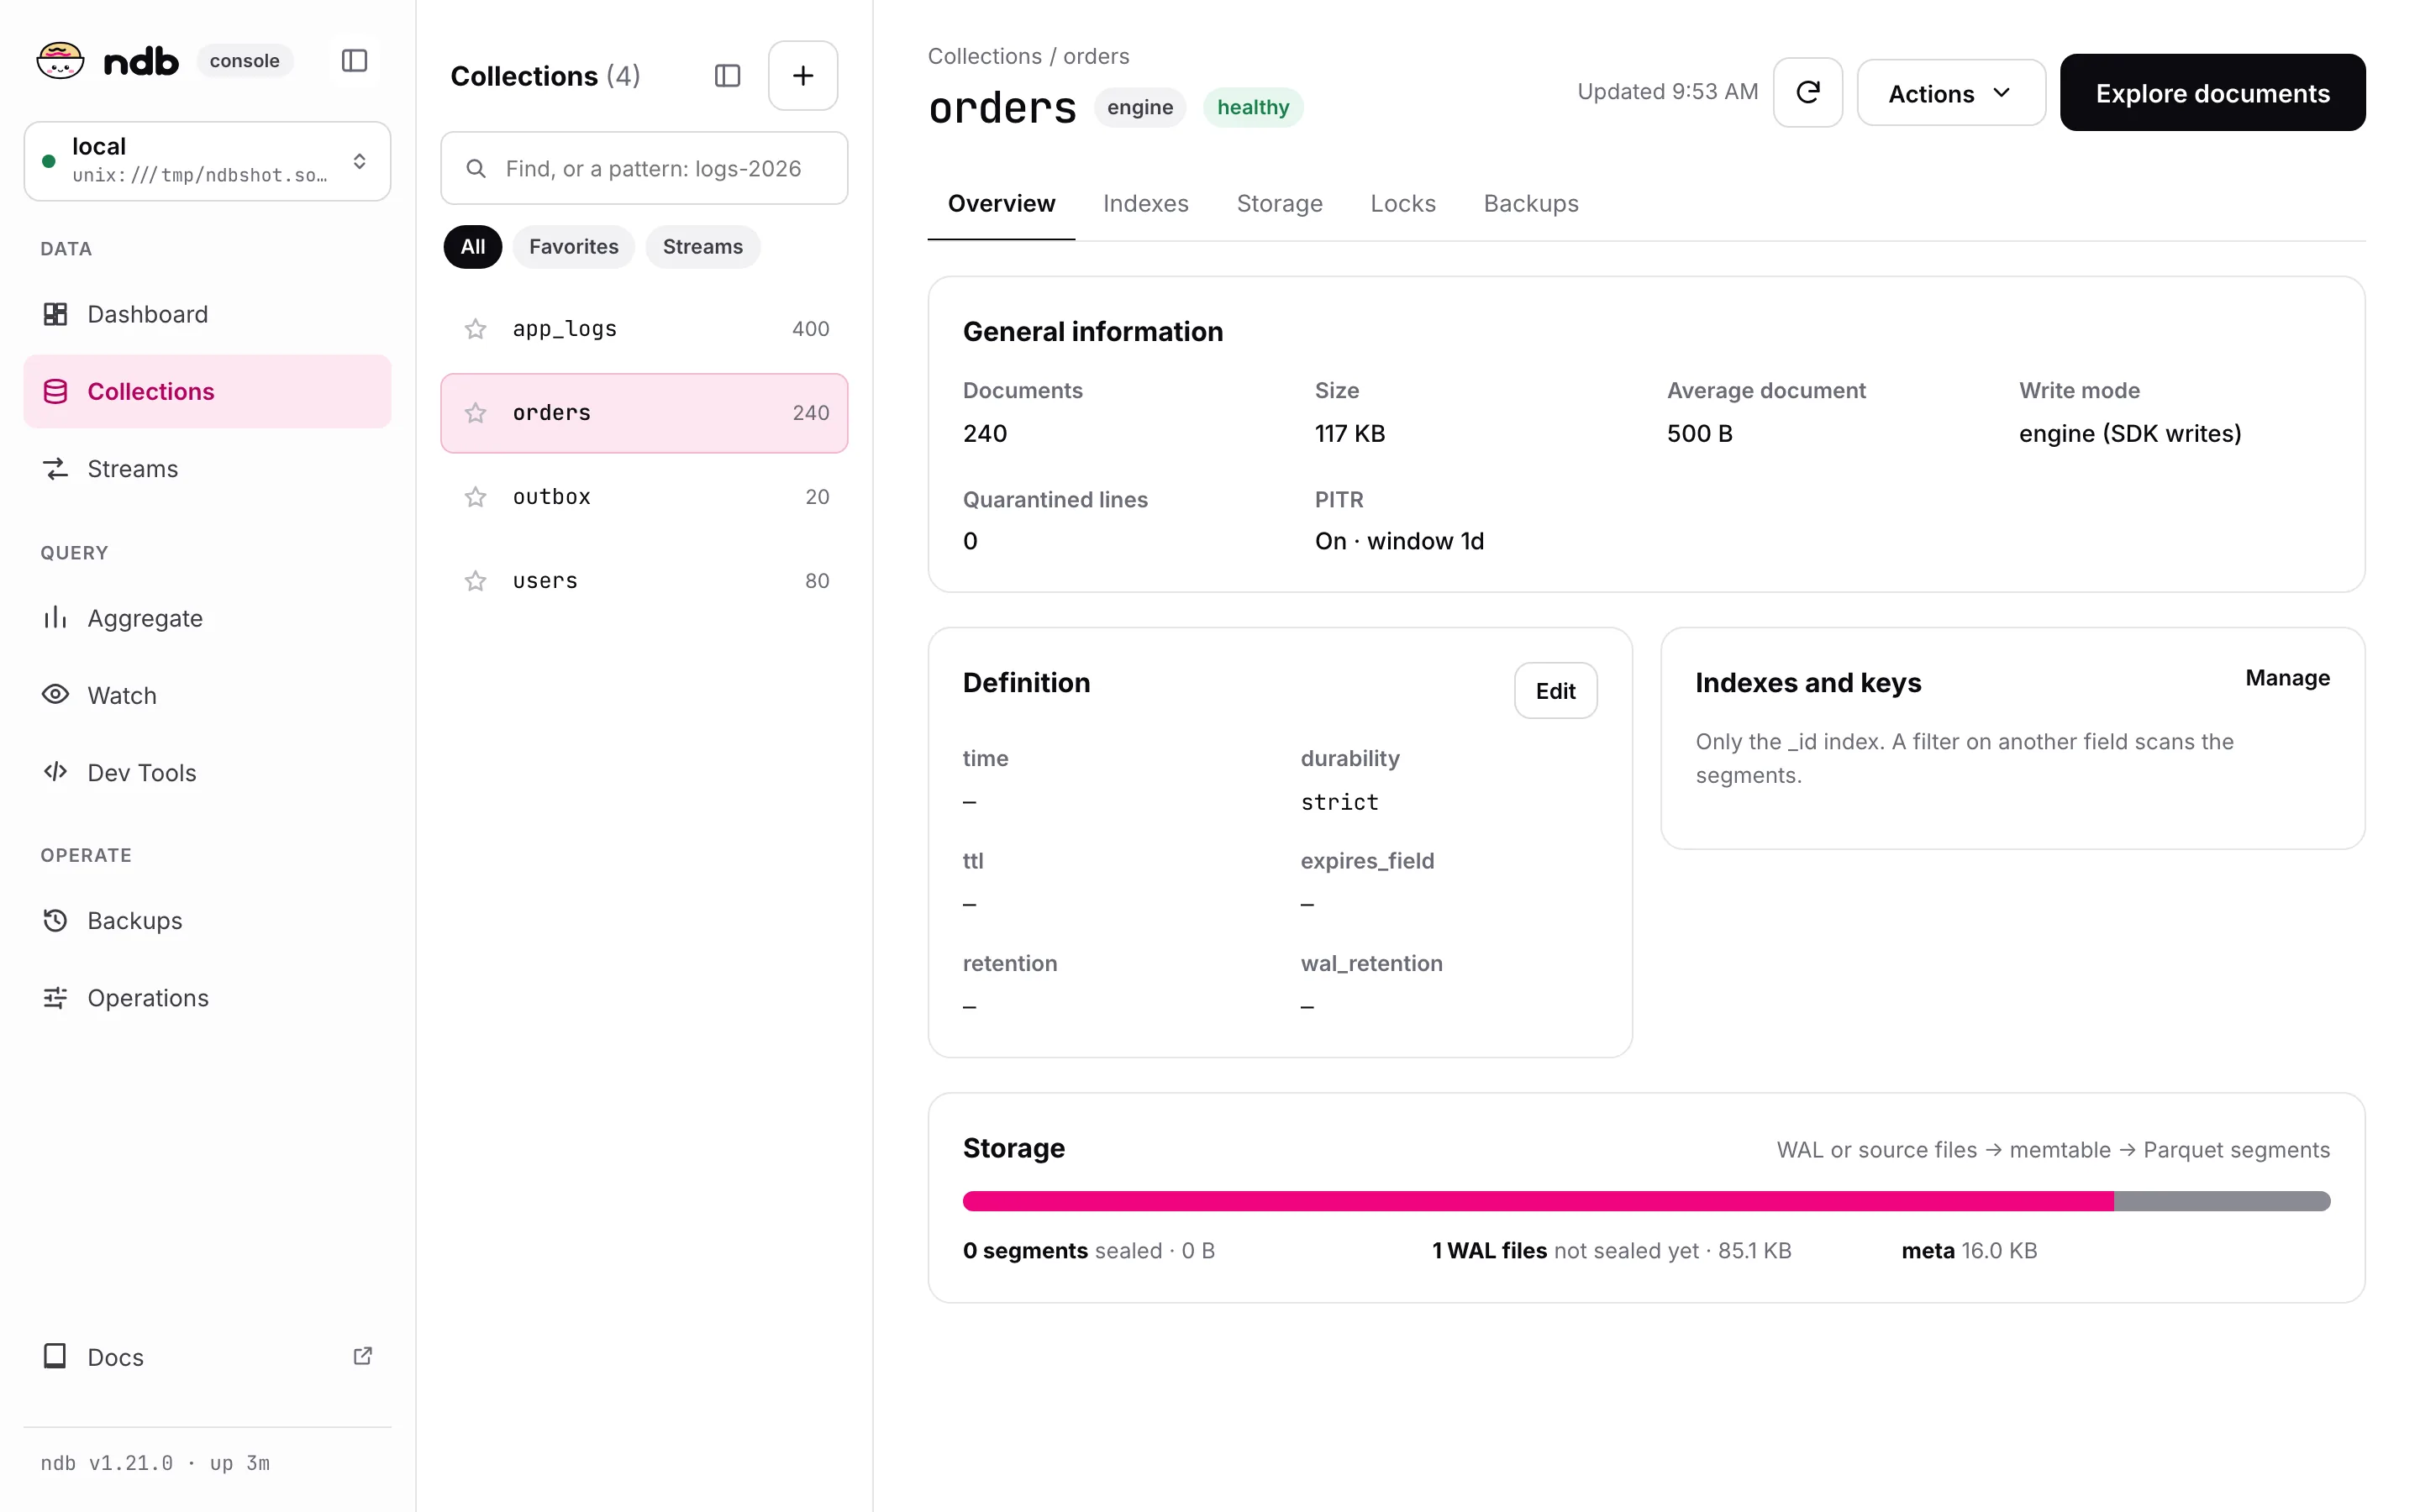
Find a collection by name or by a pattern (logs-2026-*), and mark favorites with the star. + makes a collection. A collection has the tabs Overview, Indexes, Storage, Locks and Backups. Actions has the changes to the collection, and Explore documents opens the browser.
Browser
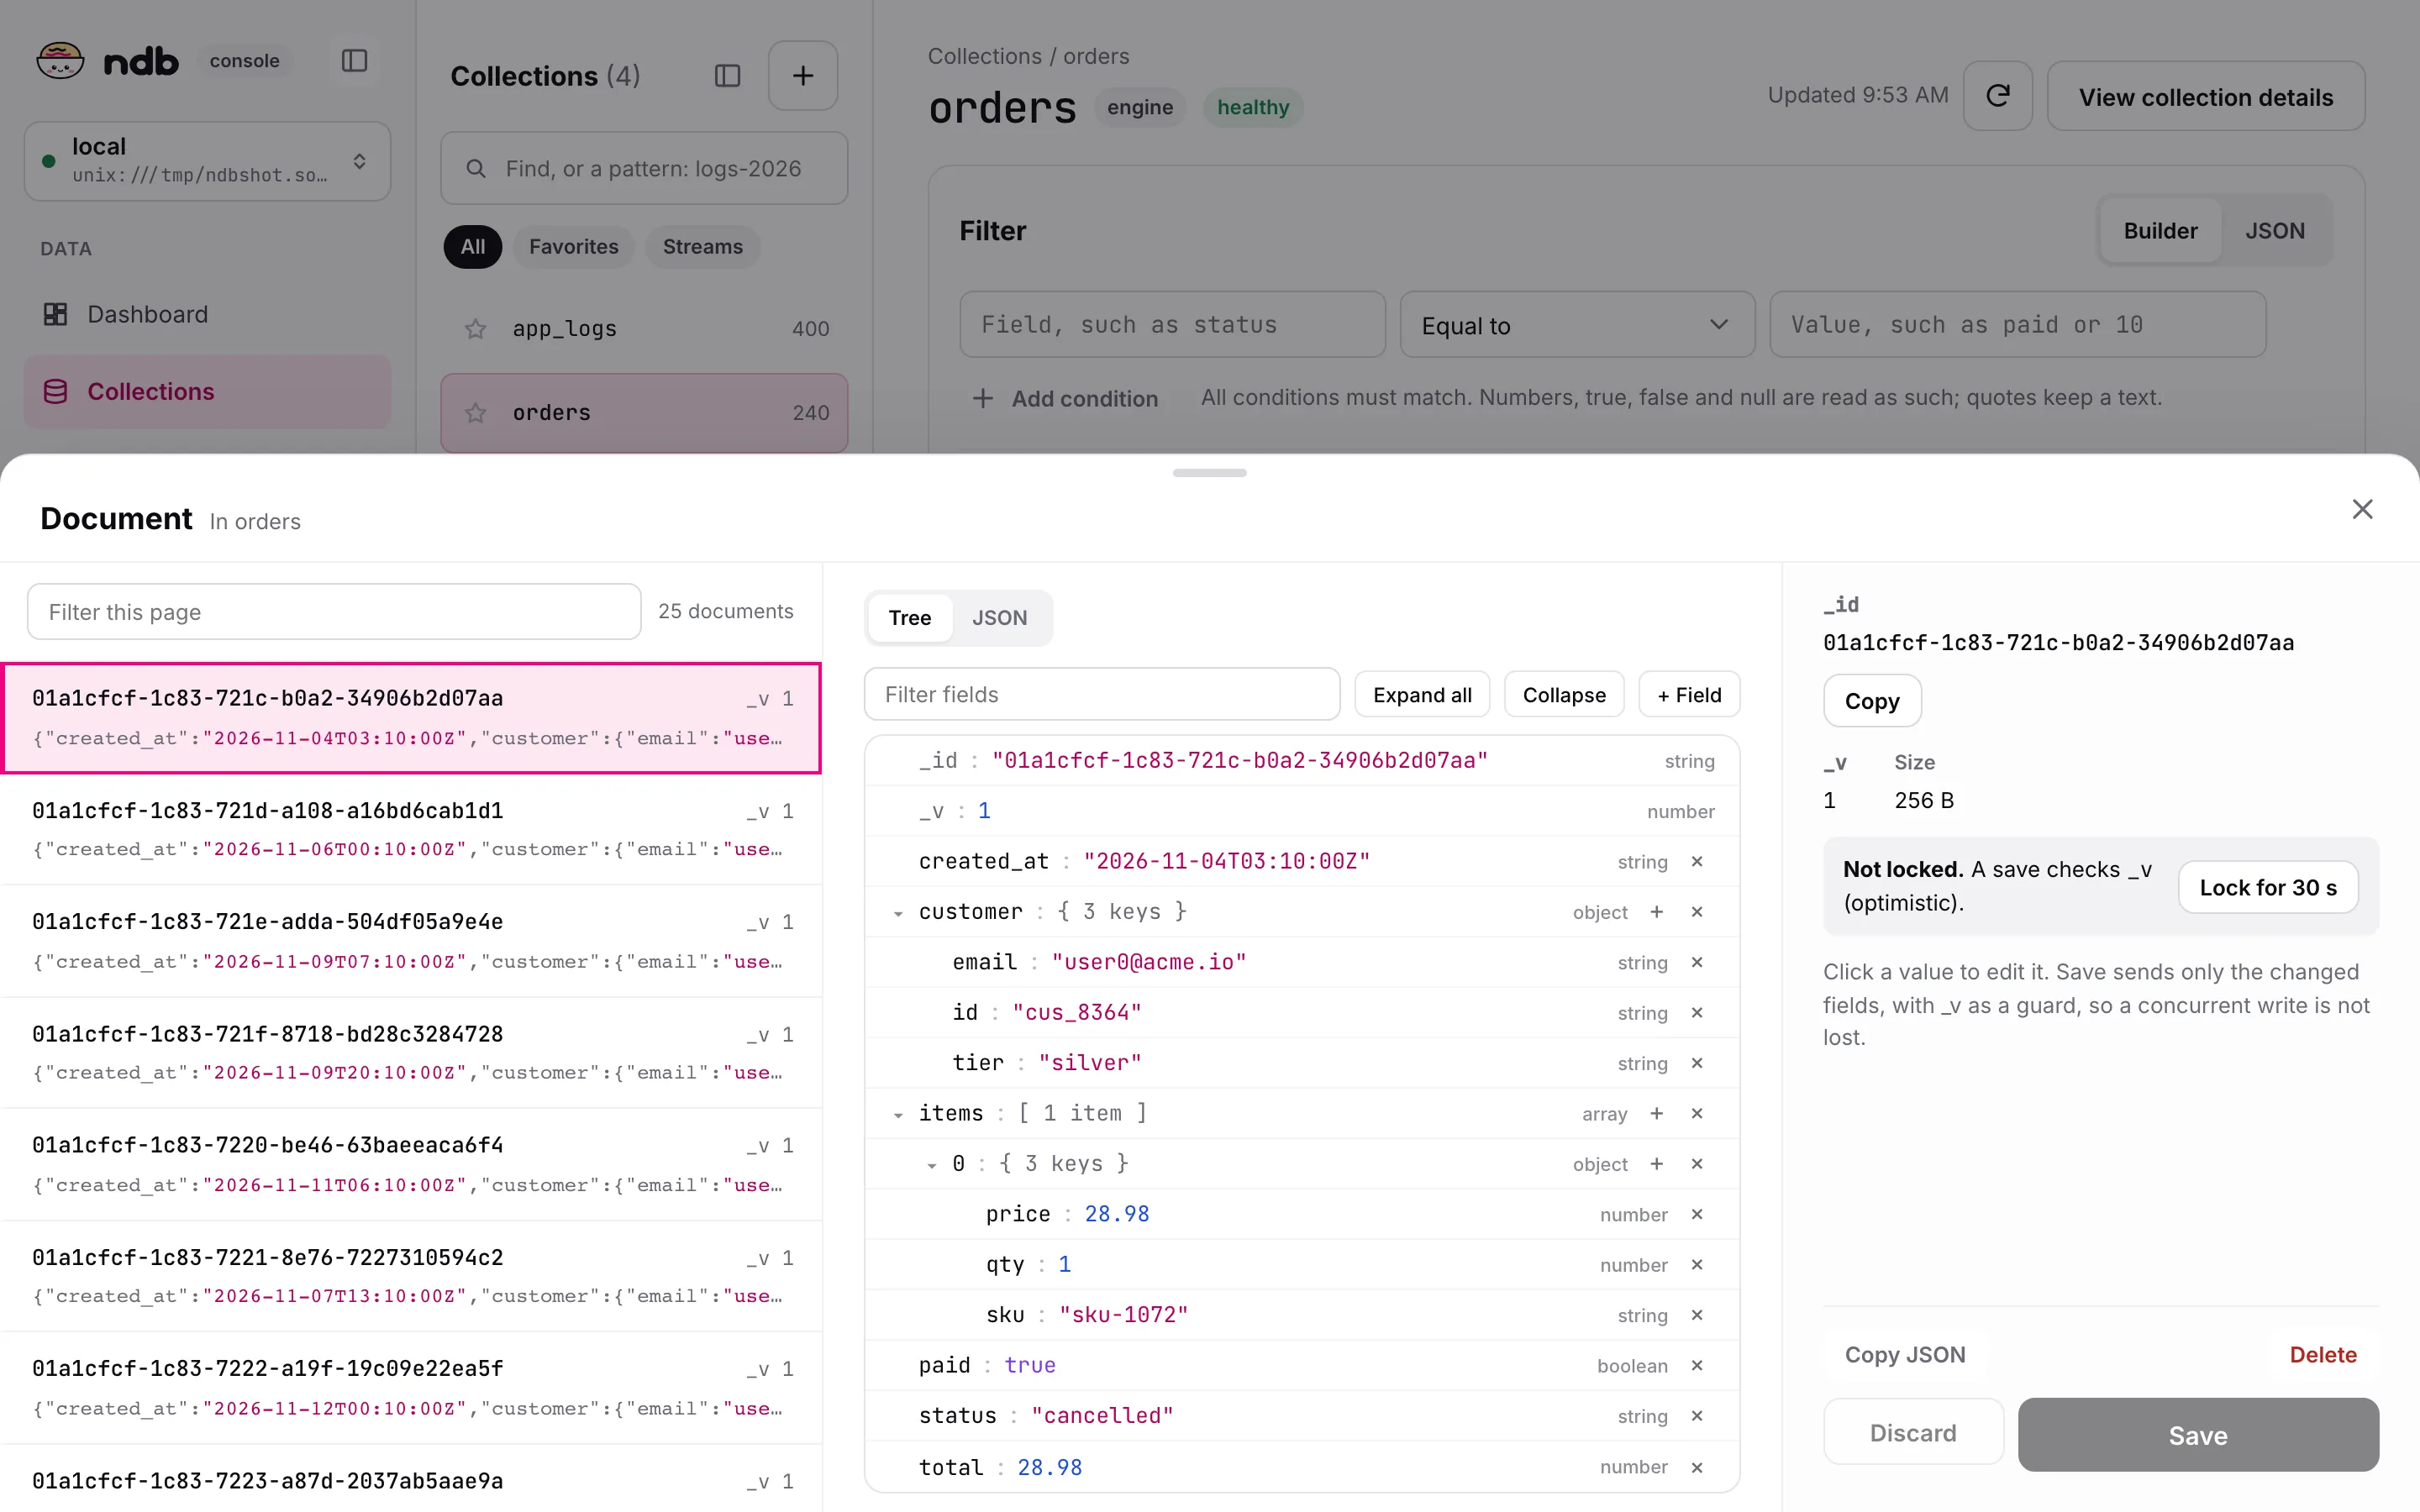
- Open a collection and select Explore documents, filter with a query (JSON, the same as a search), and page with Next. The line under the filter shows the plan and the rows examined.
- The selected document opens as a tree: click a value to edit it, + Field adds one, × removes one. JSON shows the raw text, which you can edit too.
- Save sends only the changed fields as
$setand$unset, with the_vthat the page was loaded with as a guard. If somebody else wrote first, nothing is written and the page says so. - + Insert adds a document; Delete asks first. A
directcollection is read-only. - The collection, the filter, the page and the selected
_idare in the URL, so a link shows the same view.
Aggregate
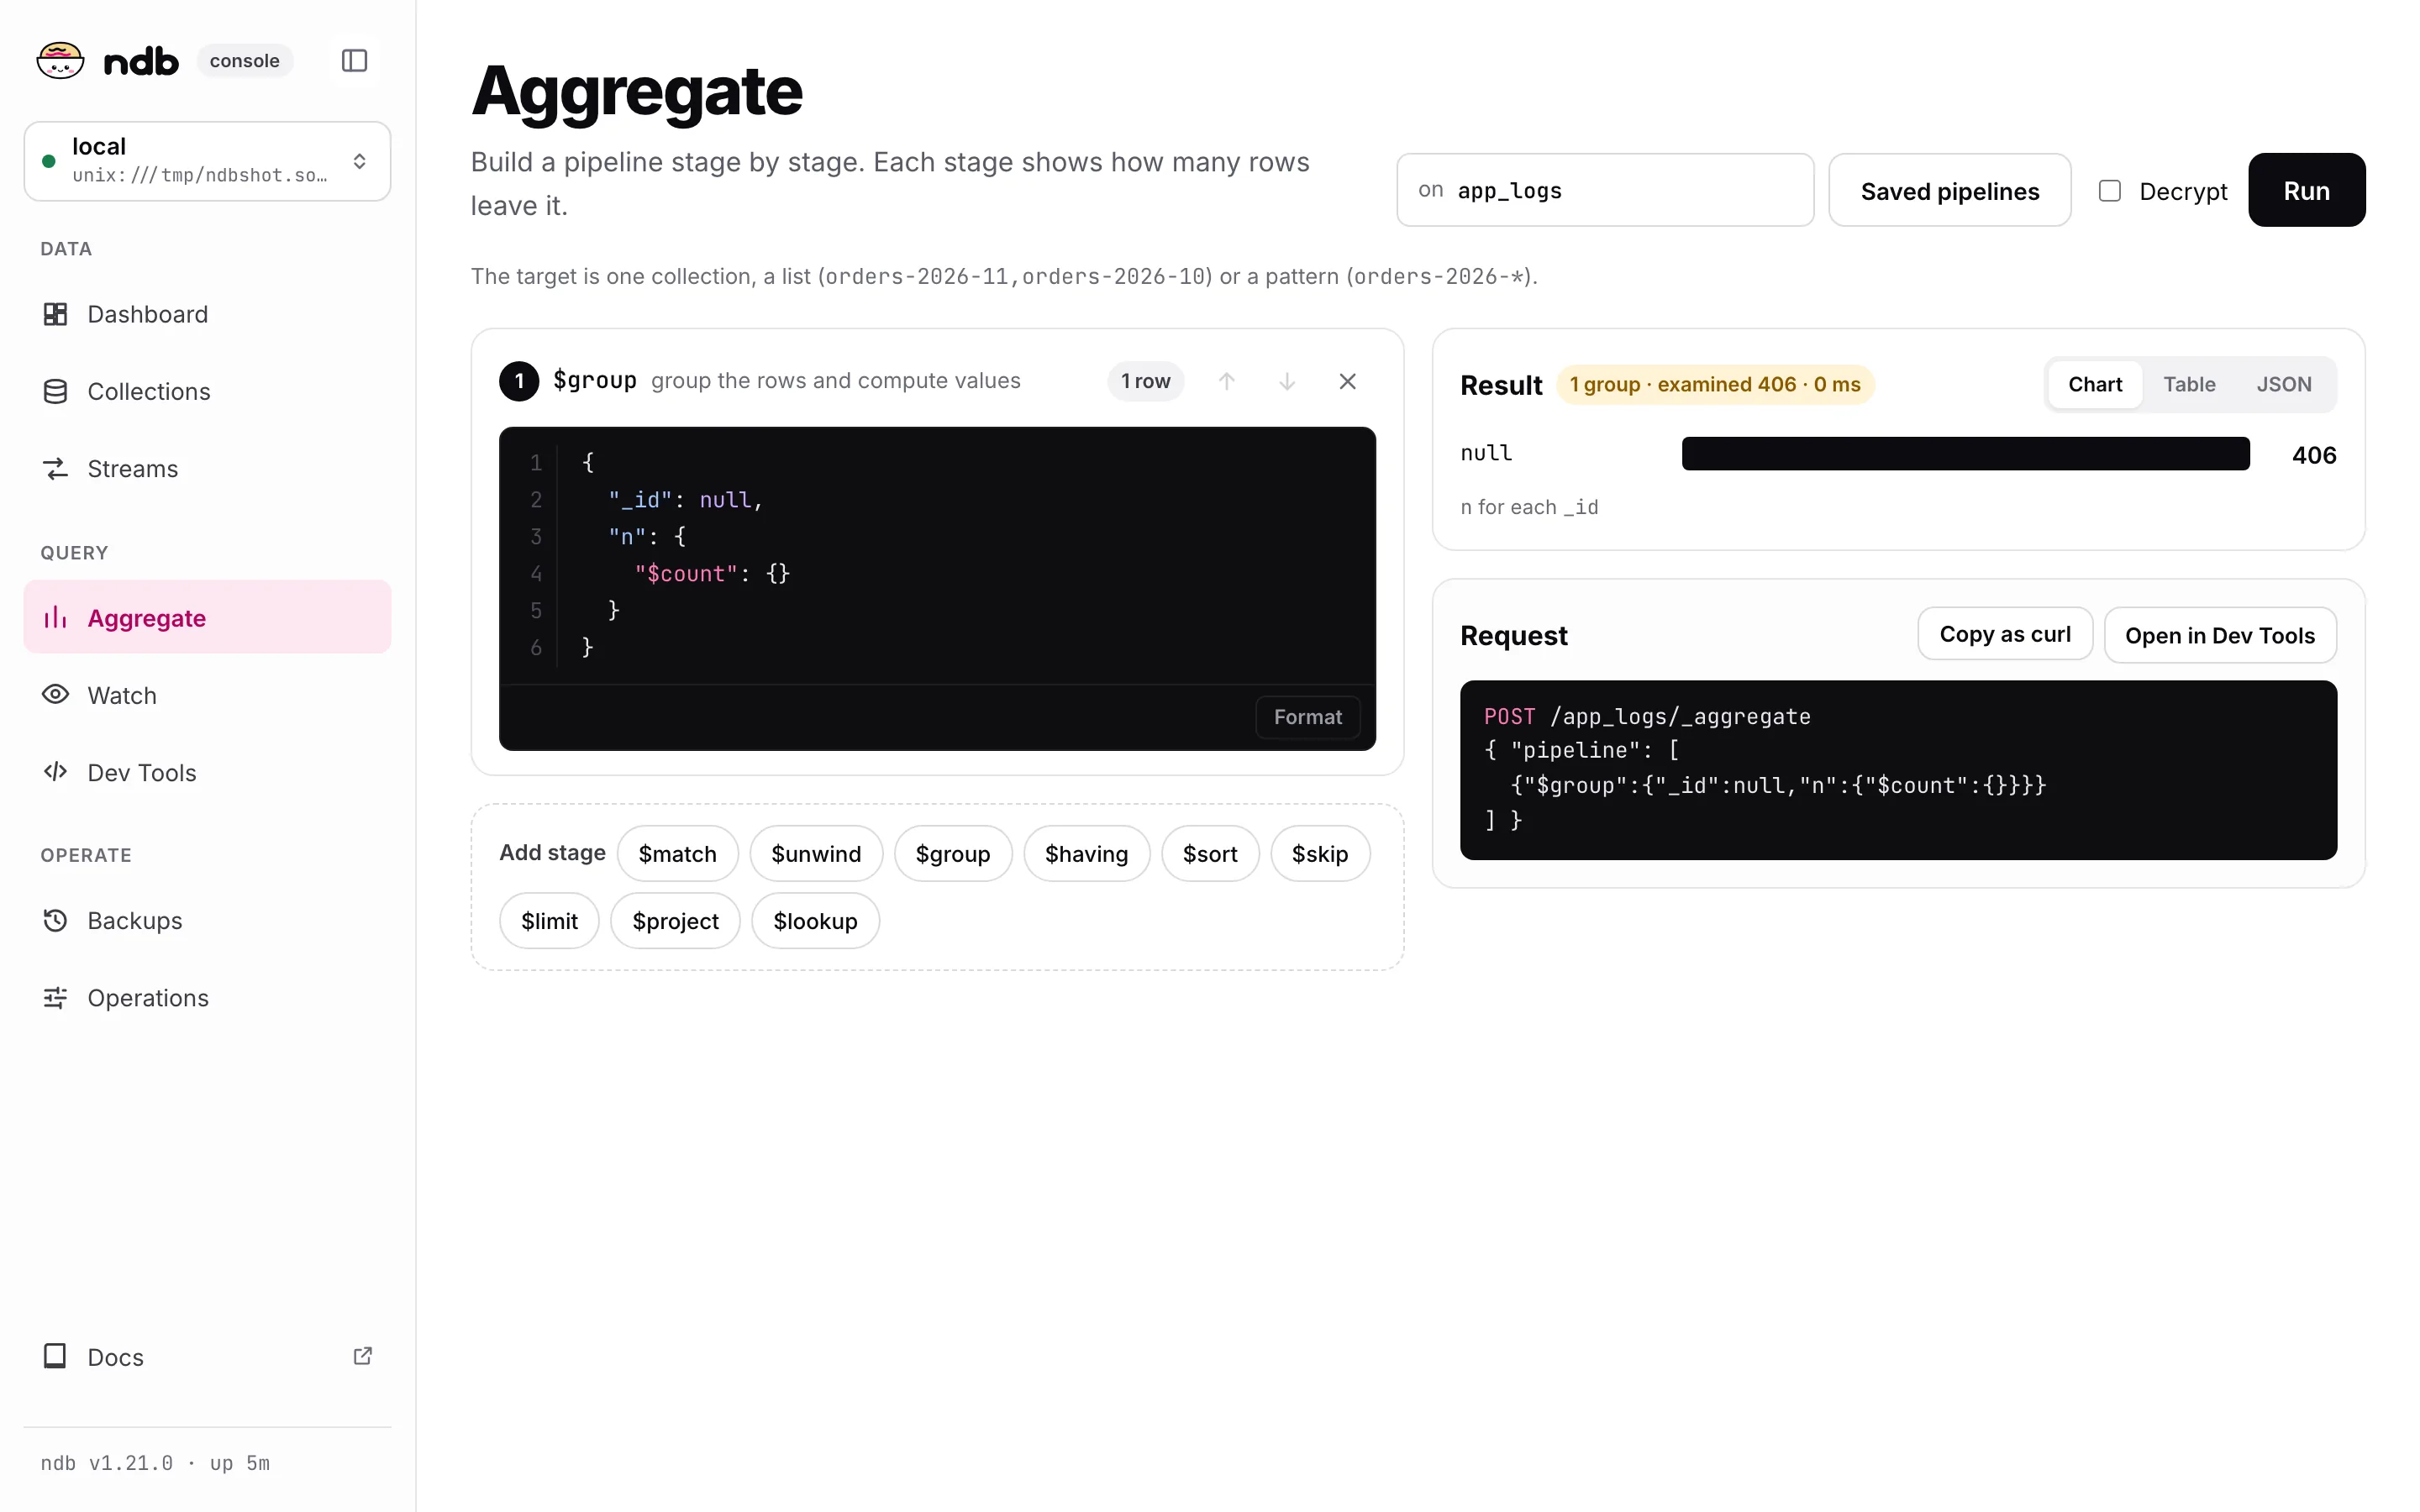
Build a pipeline stage by stage on one collection, a list, or a pattern. Each stage shows how many rows leave it. The result shows as Chart, Table or JSON. Saved pipelines keeps a pipeline, Copy as curl and Open in Dev Tools give the request.
Dev Tools
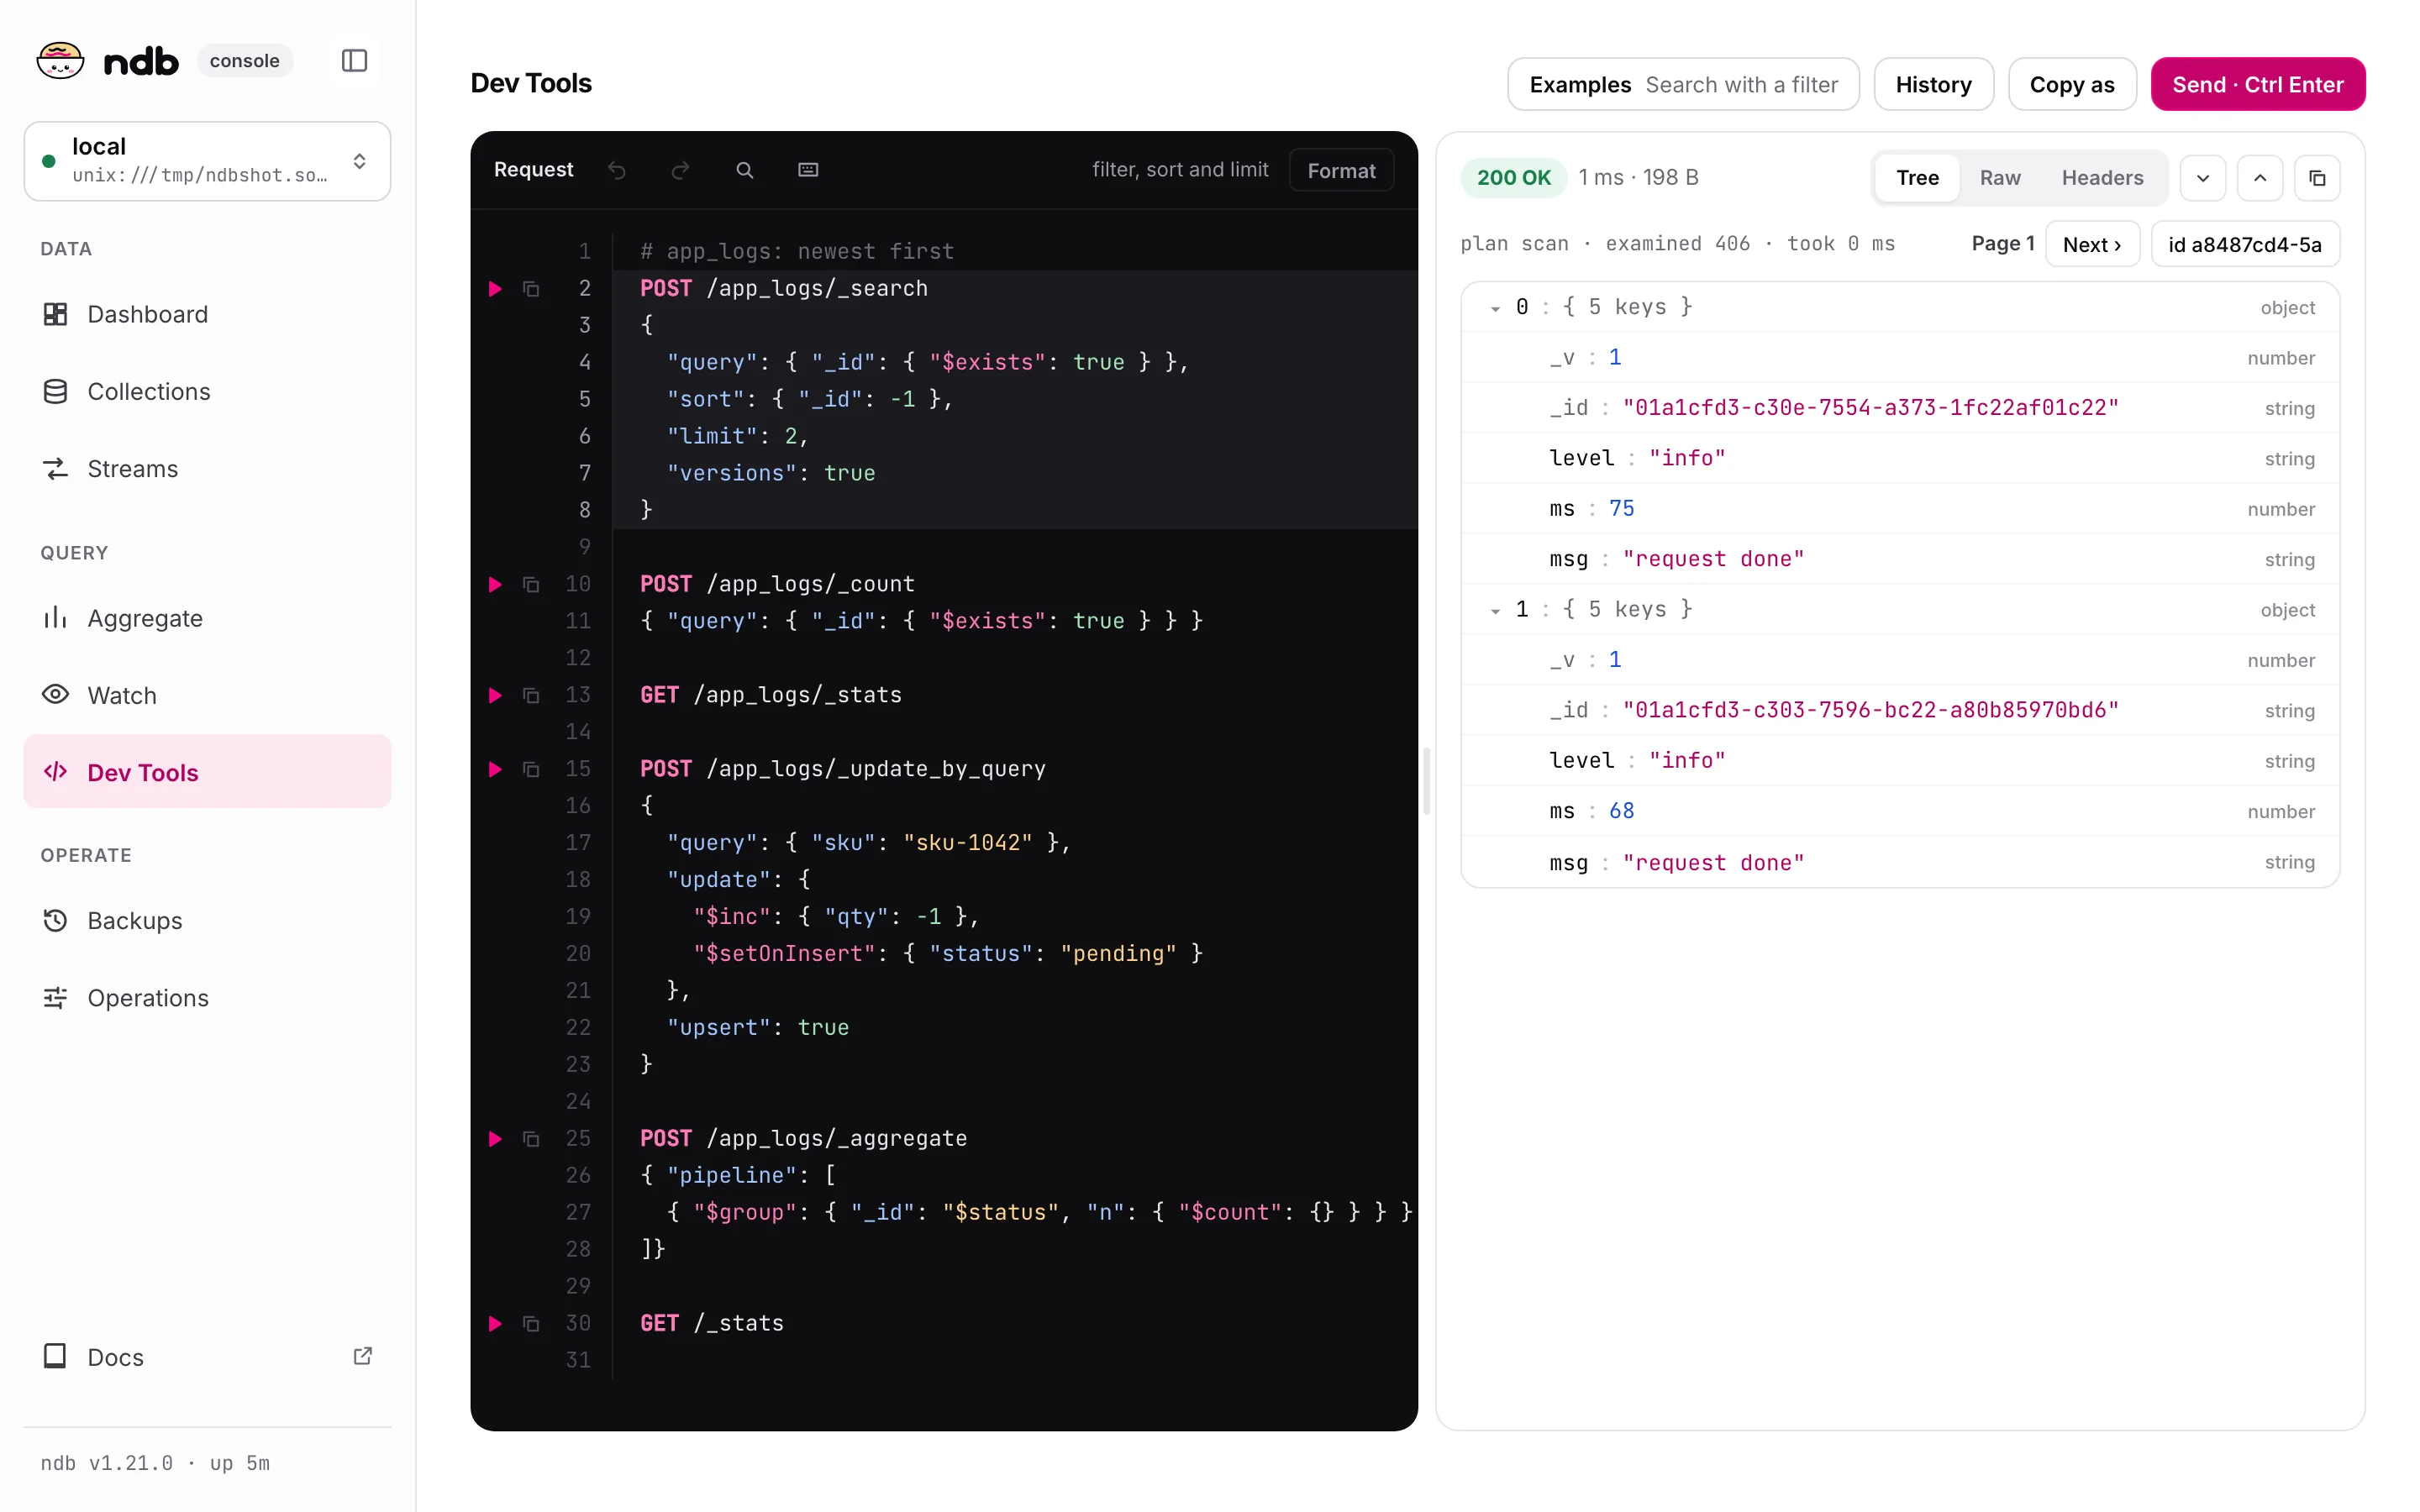
- Write requests as
METHOD /pathwith an optional JSON body under it. ▶ marks each request; Cmd/Ctrl + Enter sends the one under the cursor. - The editor indents for you: Enter keeps the indent and opens
{ }blocks,}dedents, Tab and Shift+Tab move lines. The{ }button on hover formats the JSON body. - The answer shows the status, time, size, the
X-Ndb-*headers, and the body as Tree, Raw or Headers. An NDJSON answer shows one node per line. - History keeps the last 50 requests, and the editor text is kept per connection in the browser. Copy as curl writes
$NDB_TOKENas a placeholder, never the token. - Every route of the HTTP API can be sent, except
/_backupand_watch, which have their own tabs.
Watch
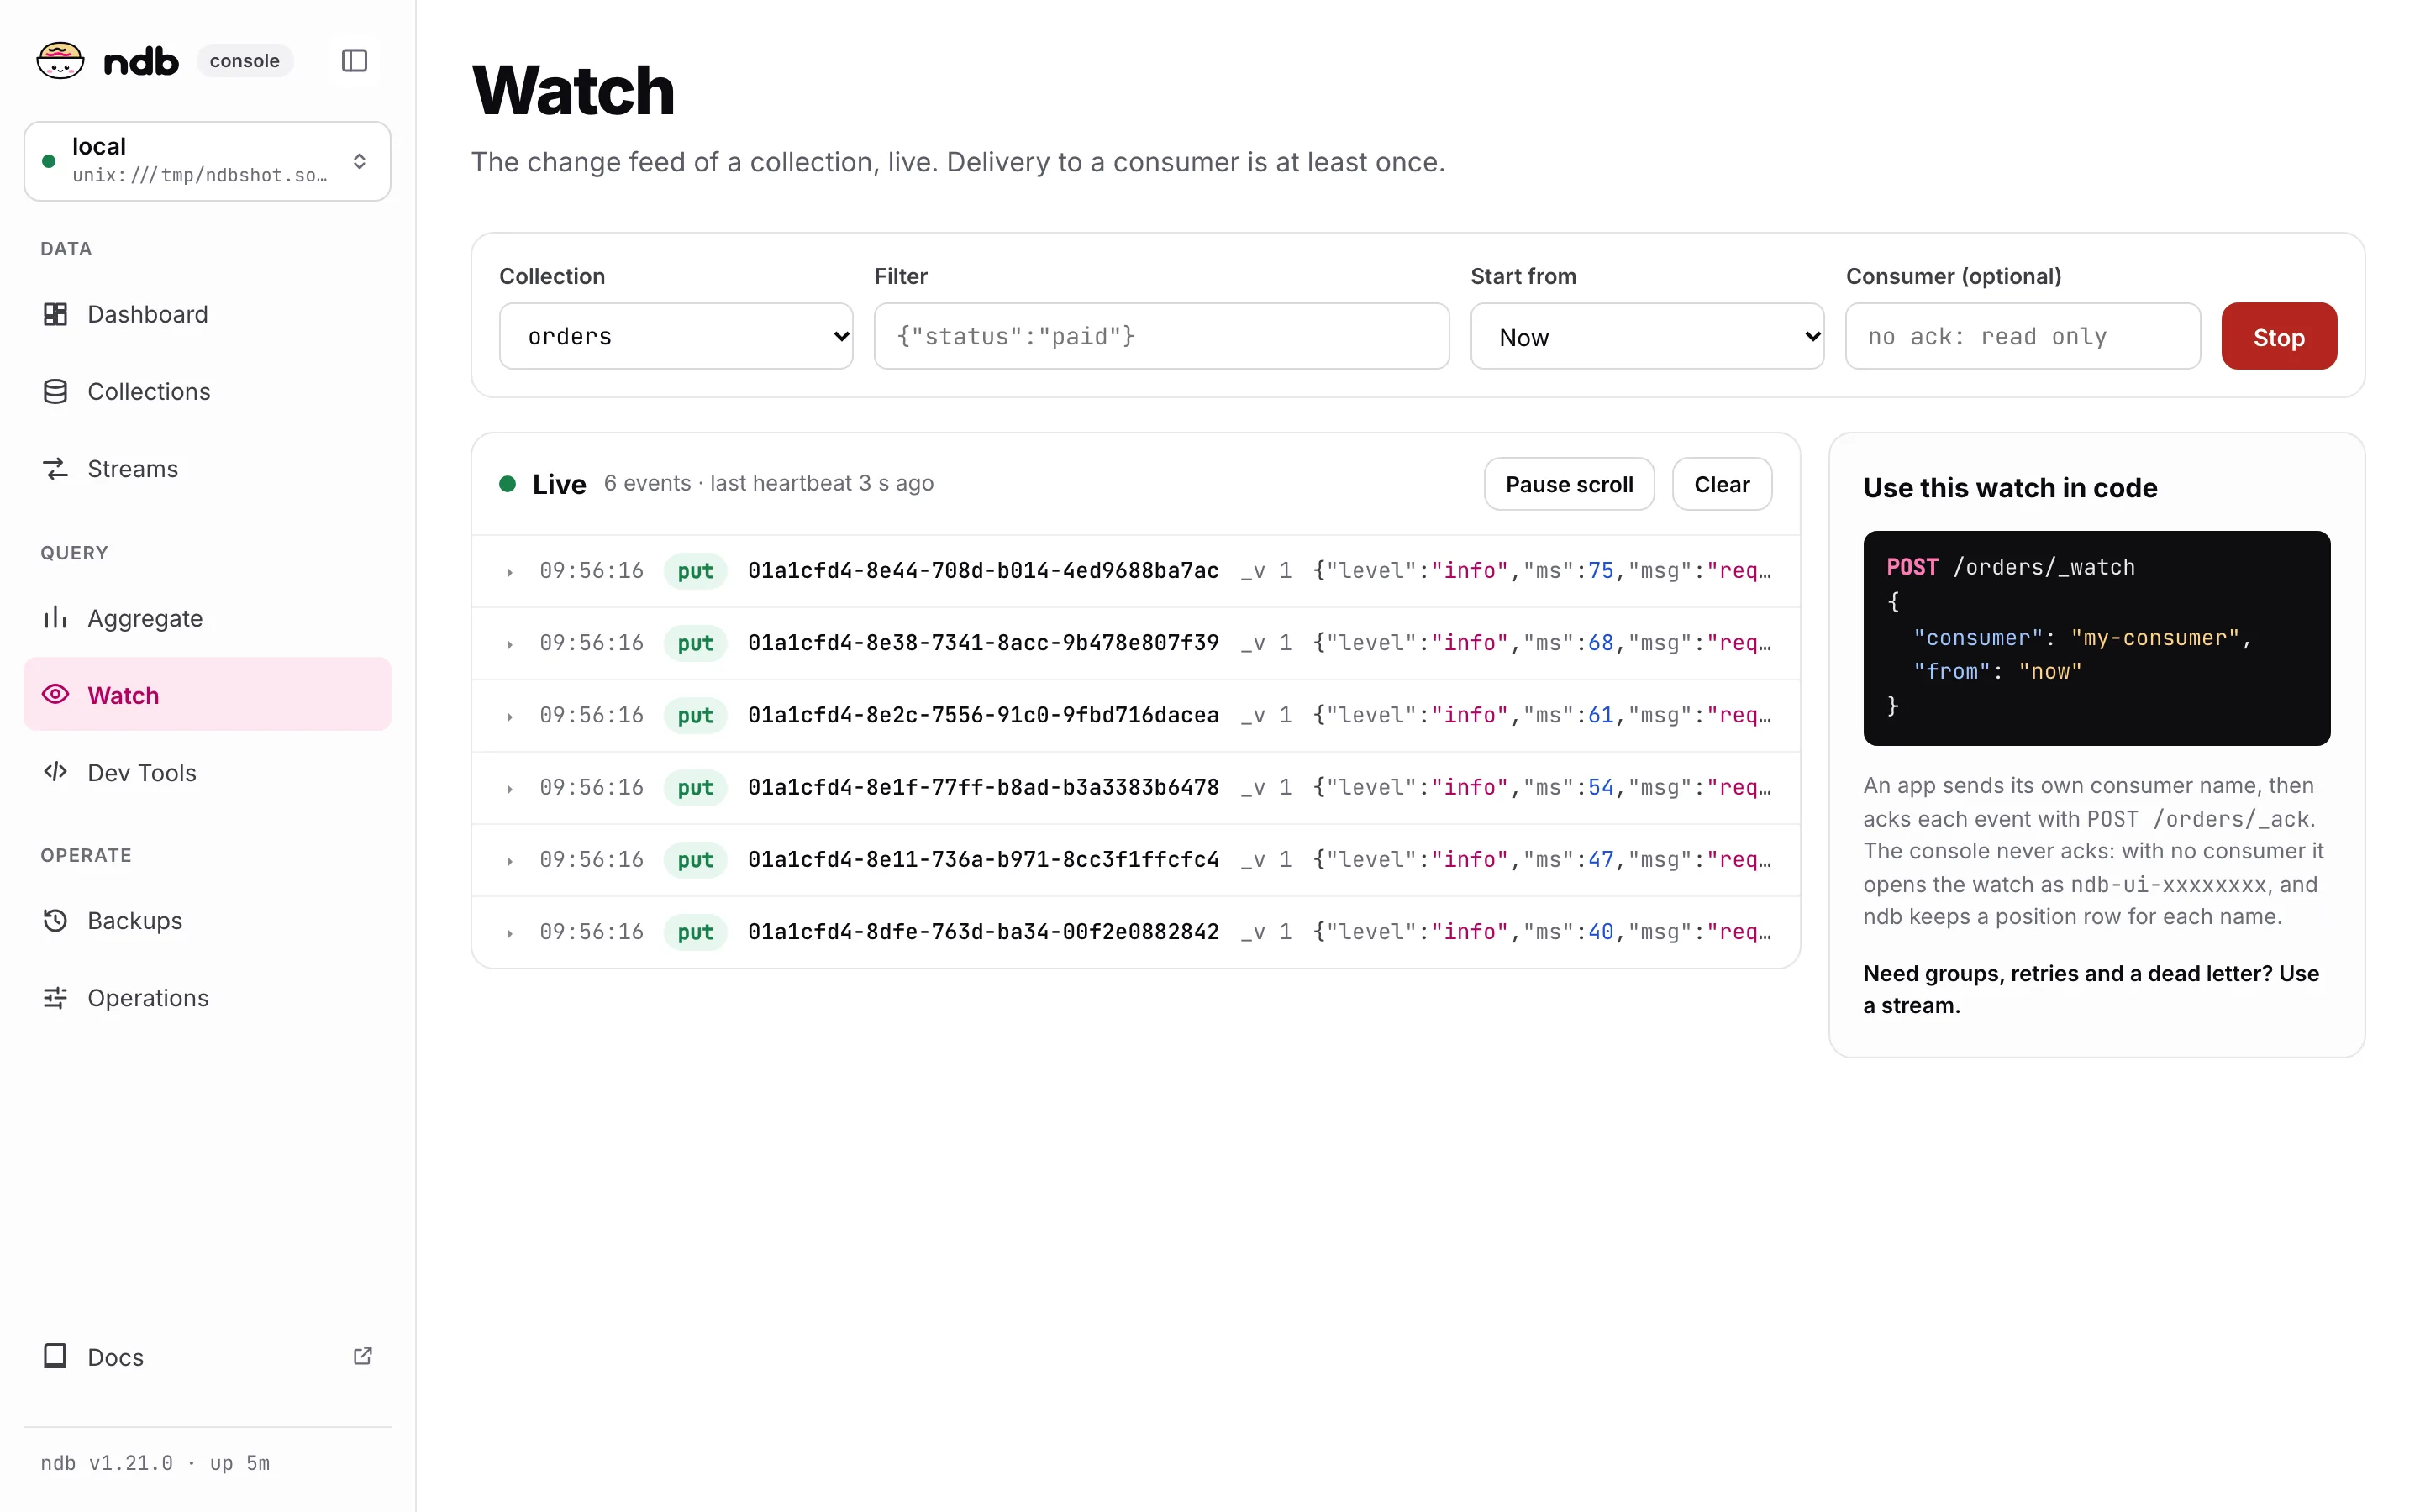
Pick a collection, optionally a query filter, and Start: each change arrives as a put or del row; click one to see the document. Pause, Clear, and Start at (now or the beginning) control the stream. The list keeps the last 500 events.
The tail only reads: it never acks. Each stream opens a watch with a consumer named ndb-ui-xxxxxxxx, and ndb stores a position row for it in cursors.bolt. With wal_retention, the WAL files from the oldest such position are kept. ndb has no call to remove a consumer yet.
Streams
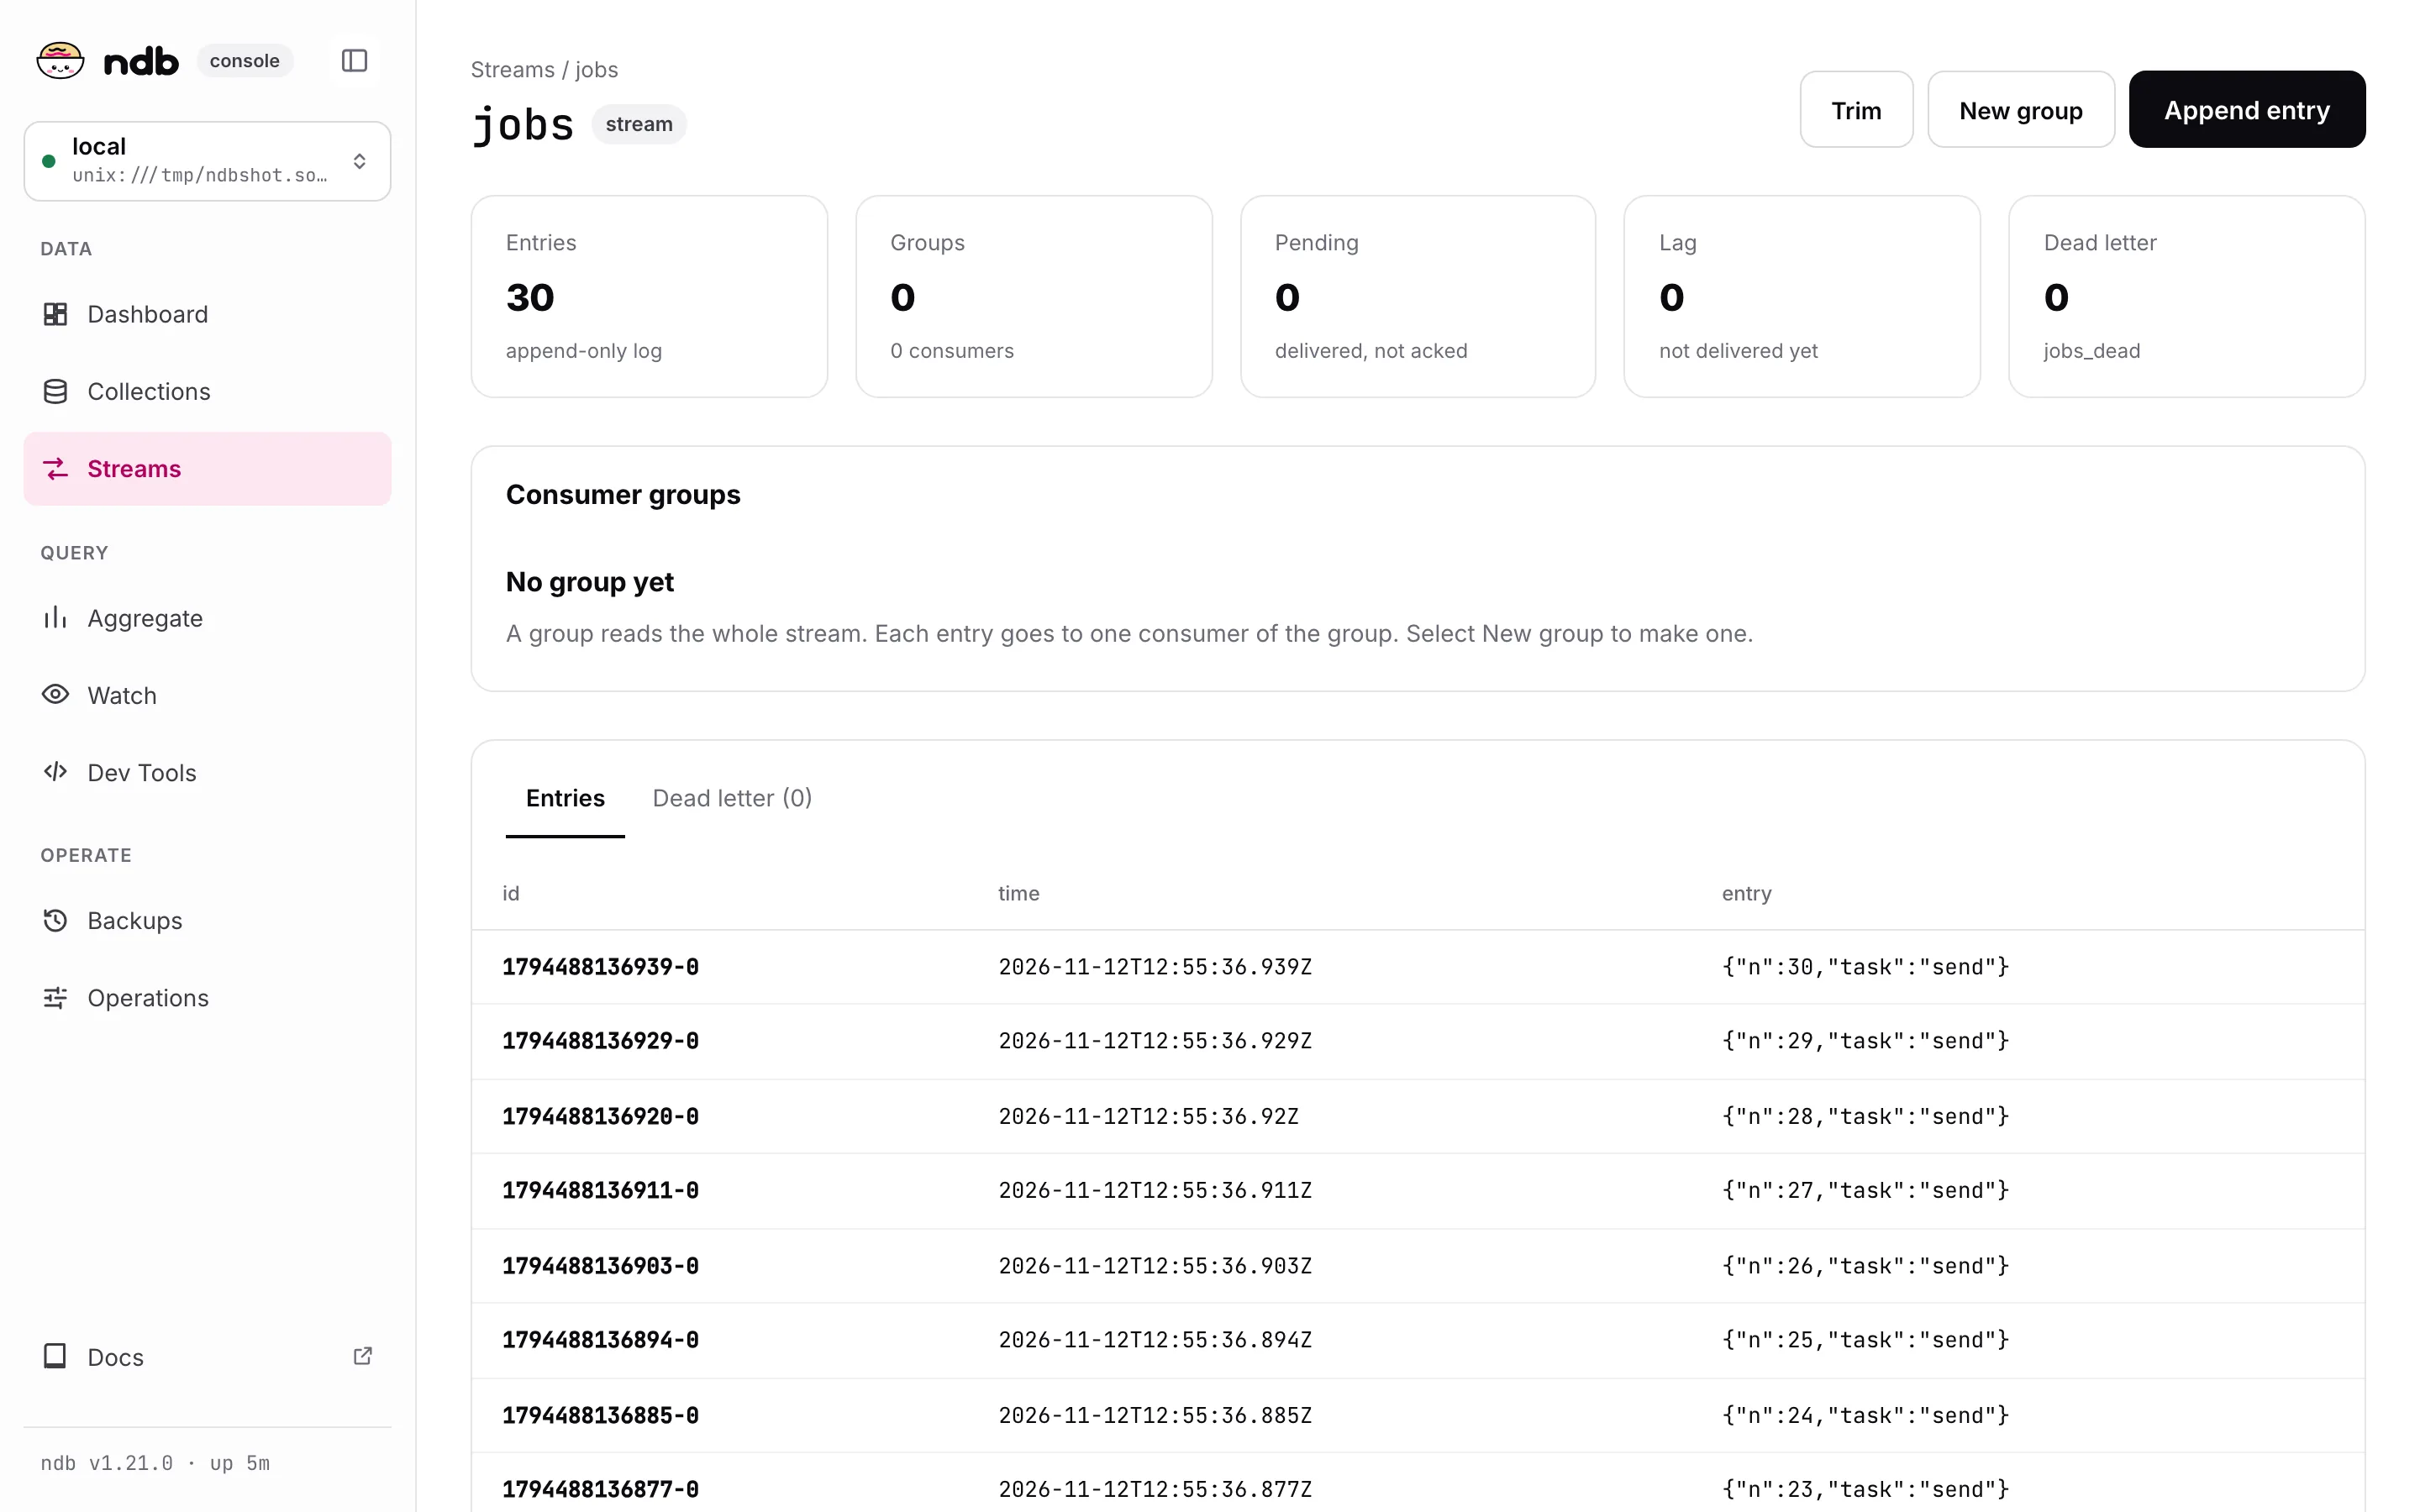
A stream shows its entries, groups, pending entries, lag and dead letter. Append entry, New group and Trim change it. The tabs show the entries and the dead letter; a group shows its pending entries.
Backups
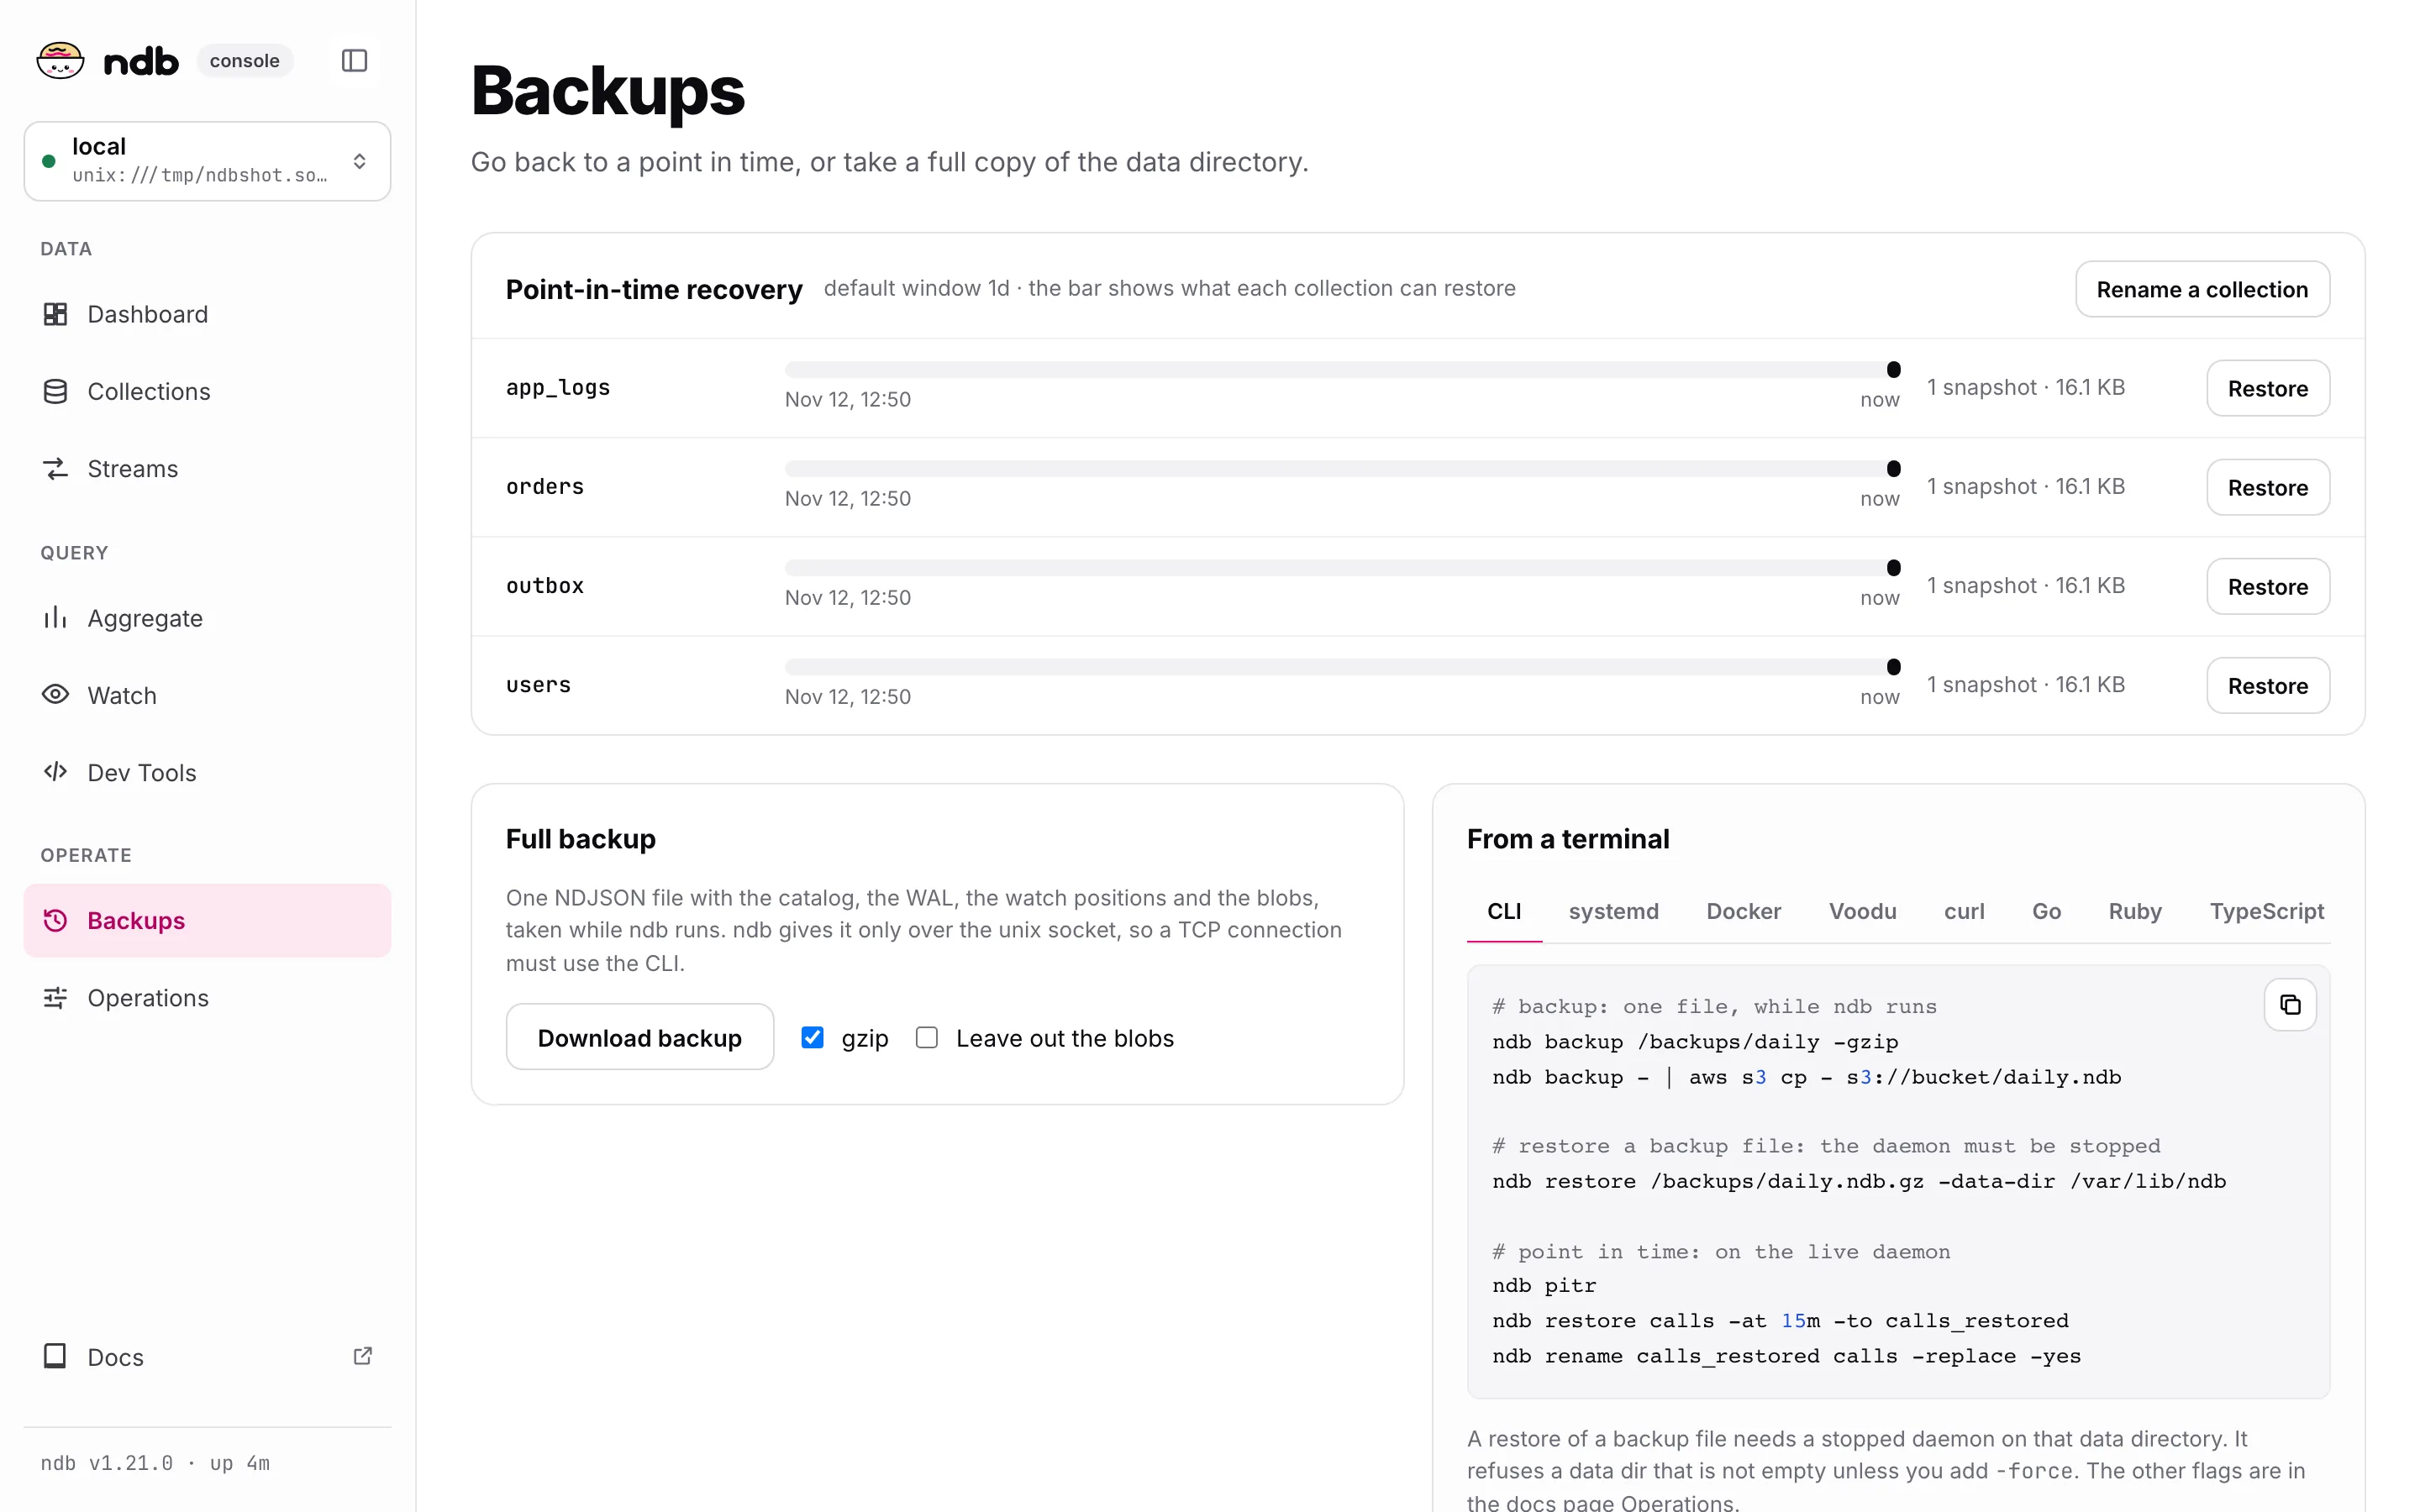
Point-in-time recovery shows the window that each collection can restore, with Restore and Rename a collection.
Download backup streams POST /_backup to a file ndb-<name>-<date>.ndb, or .ndb.gz with gzip. It works on a unix socket connection only (ndb answers 403 over TCP; run ndb backup on the host). Restore is not in the console, because it replaces the data directory while ndb is stopped: copy the command from the page. See Backup and restore.
Operations
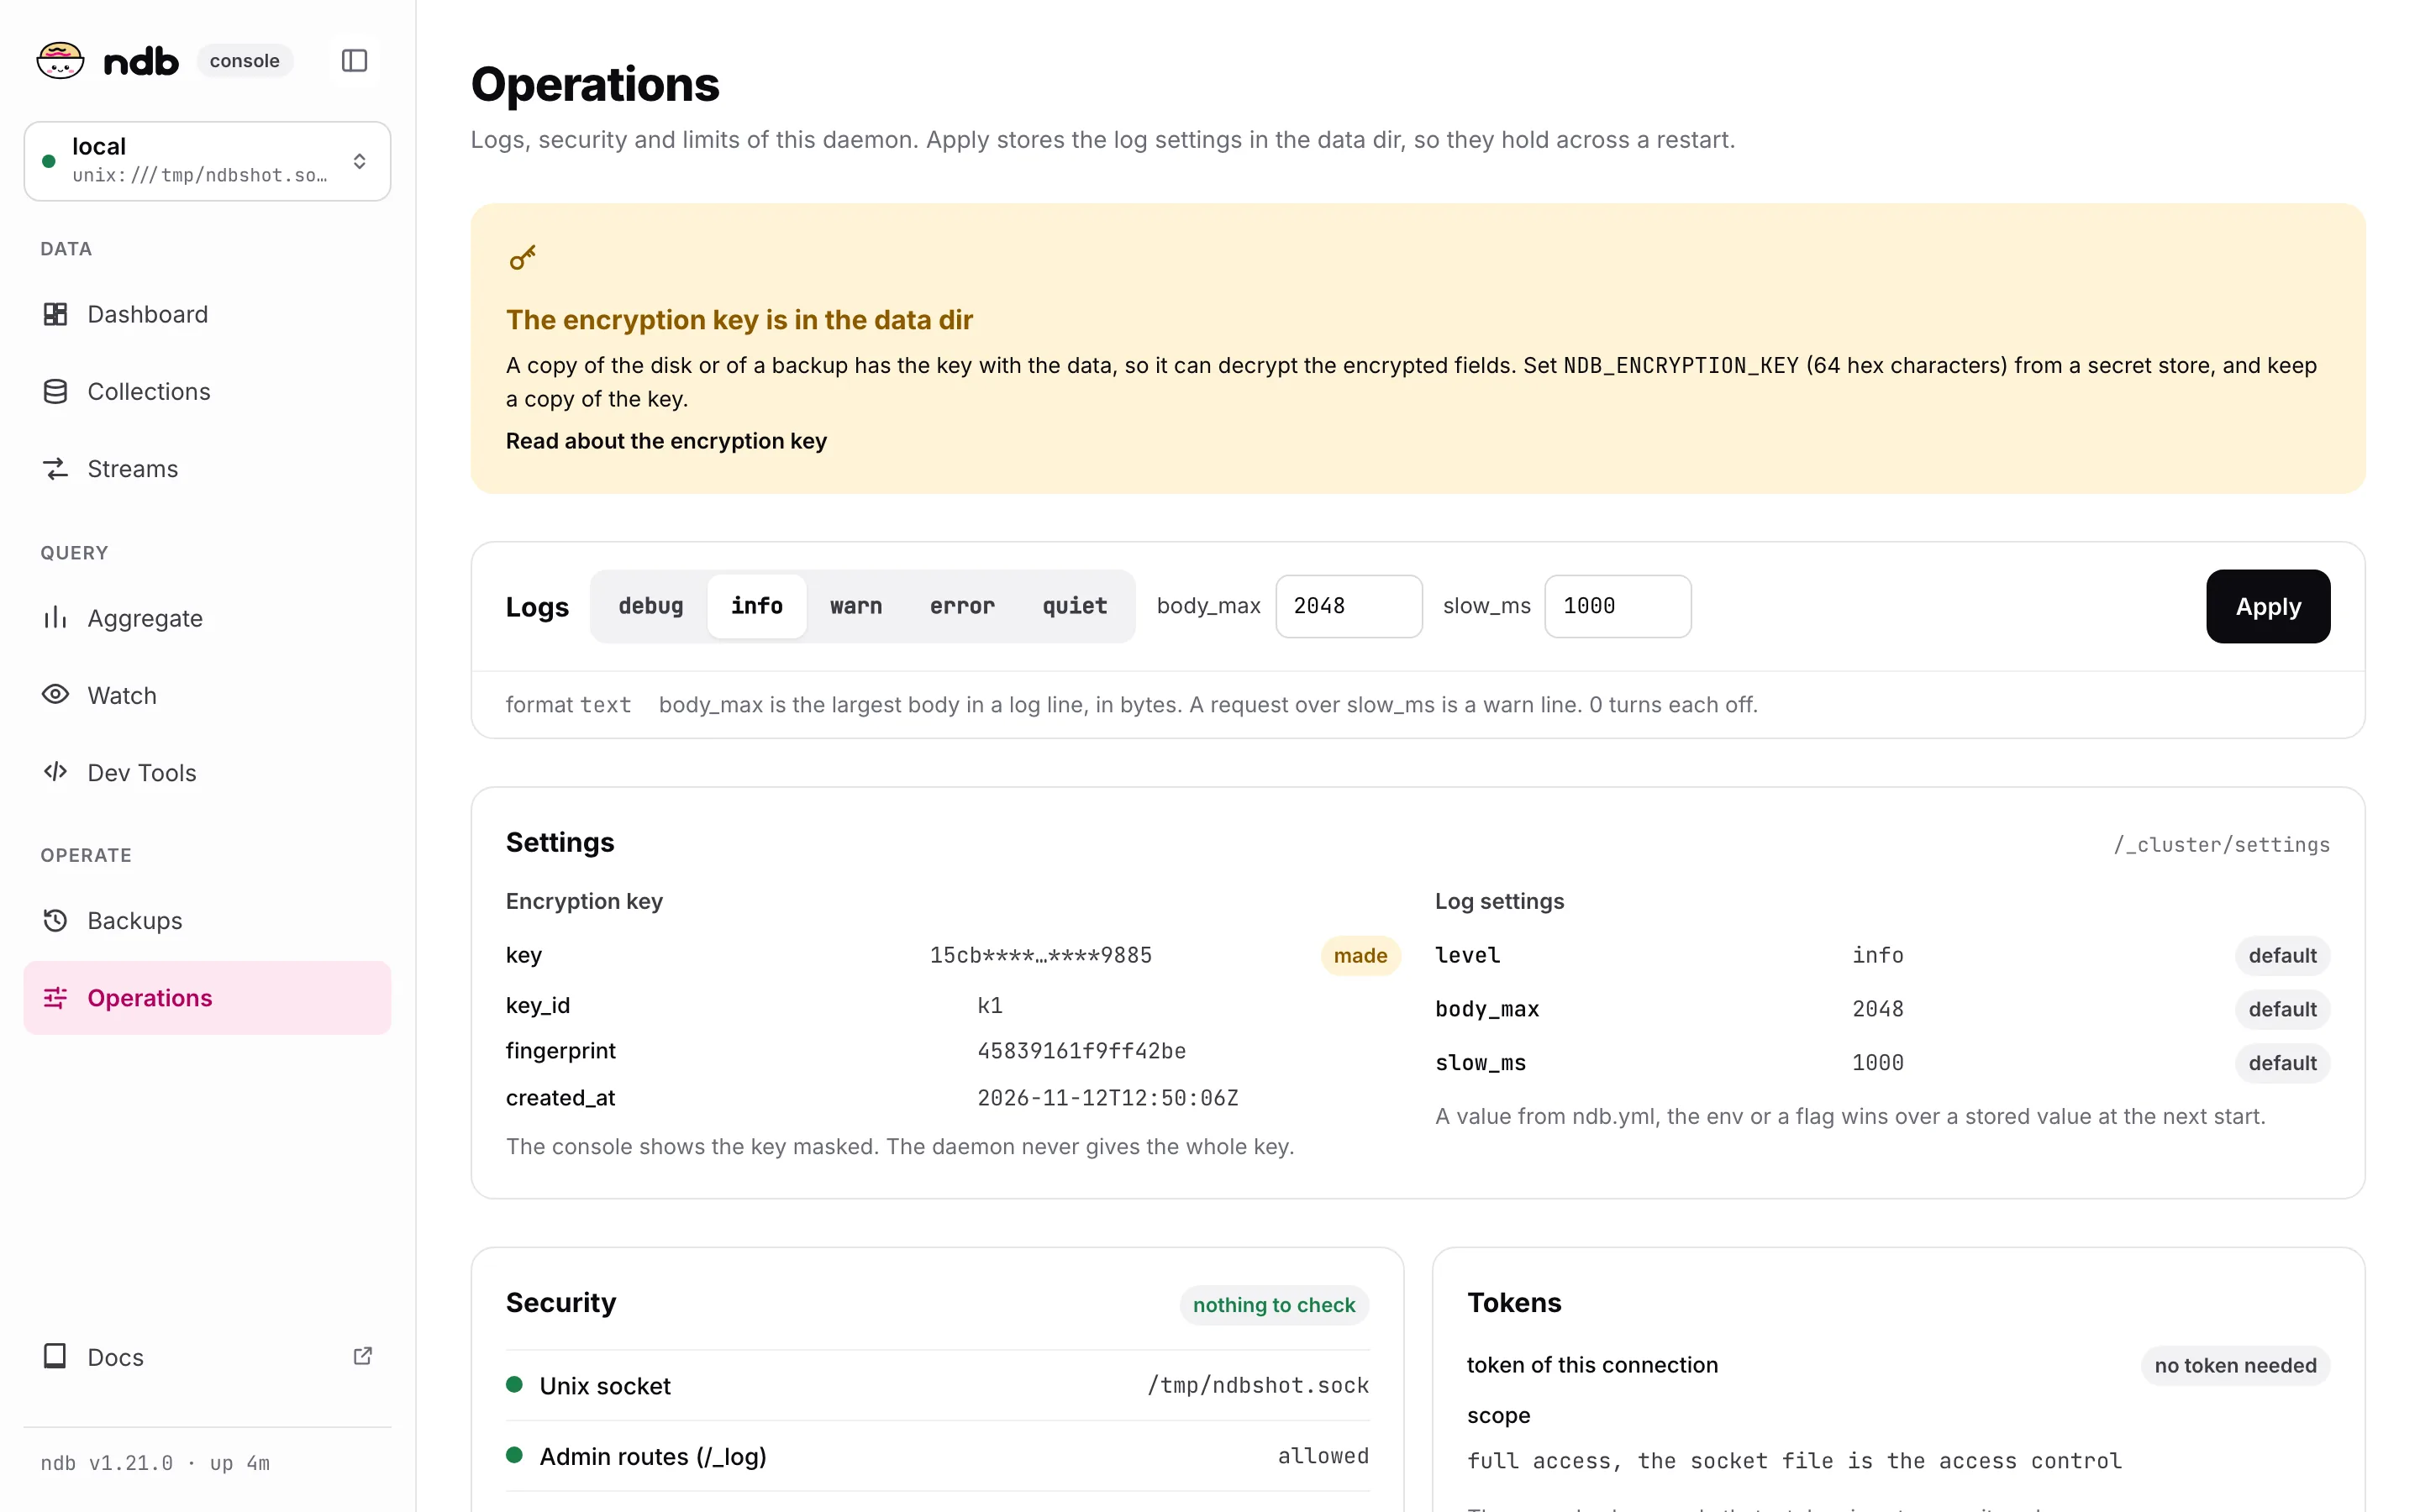
The log level and the log limits (body_max, slow_ms): Apply stores them in the data dir, so they hold across a restart. The page also shows the encryption key (masked), the settings of /_cluster/settings, the security checks and the token of the connection.